
How is NPS calculated?
NPS = % promoters − % detractors
Sort answers to the recommend question into three buckets, 9–10 are promoters, 7–8 passives, 0–6 detractors, then subtract the detractor percentage from the promoter percentage. Passives count toward the total but toward neither percentage. Scores run from -100 to +100: 120 promoters and 40 detractors out of 200 responses gives an NPS of 40.
Above zero, promoters outnumber detractors. Above 20 is generally read as favorable, above 50 excellent, above 70 world class, and every one of those bars shifts by industry. The trend beats any single reading. Watch the passives, who pull the score toward zero and are usually the easiest group to move, and treat a monthly NPS built on a few dozen responses as a sketch, not a measurement.
Forward survey exports into a Ferra table and NPS by month, plan, or segment becomes a question, not a formula.
How the NPS calculator works
Count people, not percentages. Enter each bucket's headcount from a single survey wave; the calculator converts to shares, subtracts detractors from promoters, and shows the score alongside each group's slice.
- Promoters (9–10)
- Everyone who answered 9 or 10. Enter the raw count, the calculator handles the percentage conversion.
- Passives (7–8)
- The 7s and 8s. They never enter the subtraction, but they enlarge the base both percentages are built on, so every one must be counted.
- Detractors (0–6)
- Everyone from 0 through 6. The band is deliberately wide, even a 6 counts against the score.
Calculating NPS
Divide promoters by total responses. Divide detractors by total responses. Subtract the second percentage from the first and write the result as a whole number from -100 to +100, no percent sign.
A survey wave collects 200 responses: 120 promoters, 60 passives, and 20 detractors. Promoters are 120 / 200 = 60% of responses, detractors 20 / 200 = 10%, so NPS = 60 − 10 = 50. The 60 passives shaped that result without ever appearing in it. They widened the denominator and pulled both percentages down.
Averaging the 0–10 answers is the classic blunder; it produces a meaningless number on the wrong scale. Dropping passives from the total is the quieter one, both percentages inflate, and usually the score with them. Every response belongs in the base; only promoters and detractors appear in the subtraction.
What is a good NPS?
Zero is where promoters and detractors balance. The working rules of thumb: above 20 is favorable, above 50 excellent, above 70 world-class and rare. Utilities and telecoms tend to run low, premium consumer brands high: a raw score with no industry frame tells you very little.
Benchmark against your own history before anyone else's. A score built on 30 responses swings wildly wave to wave, and the survey method moves scores on its own: email and in-app answers differ, and so does asking at a different point in the customer lifecycle. Hold the method constant and the trend you track is real.
How to improve NPS
Detractors with fewer reasons to complain, passives nudged into enthusiasm: that's the whole game. The open-text follow-ups tell you where to start.
- Close the loop with detractors
- Follow up personally within days of a low score. A complaint that gets resolved often returns as a promoter at the next wave.
- Fix the loudest complaint first
- The written reasons behind low scores cluster fast. Fixing the number-one theme moves more points than broad polish.
- Rebuild onboarding
- Many detractor scores trace back to a rough first month. Customers who reach value quickly rarely score below 7.
- Move the 7s and 8s
- Passives are one good experience away from a 9. Small improvements aimed at this group raise the promoter share without fixing anything broken.
- Ask at the same moment every time
- Timing changes scores by itself. Survey at one consistent point in the lifecycle, or the real trend gets buried.
Other calculators
Browse all calculatorsRelated templates
Browse all templates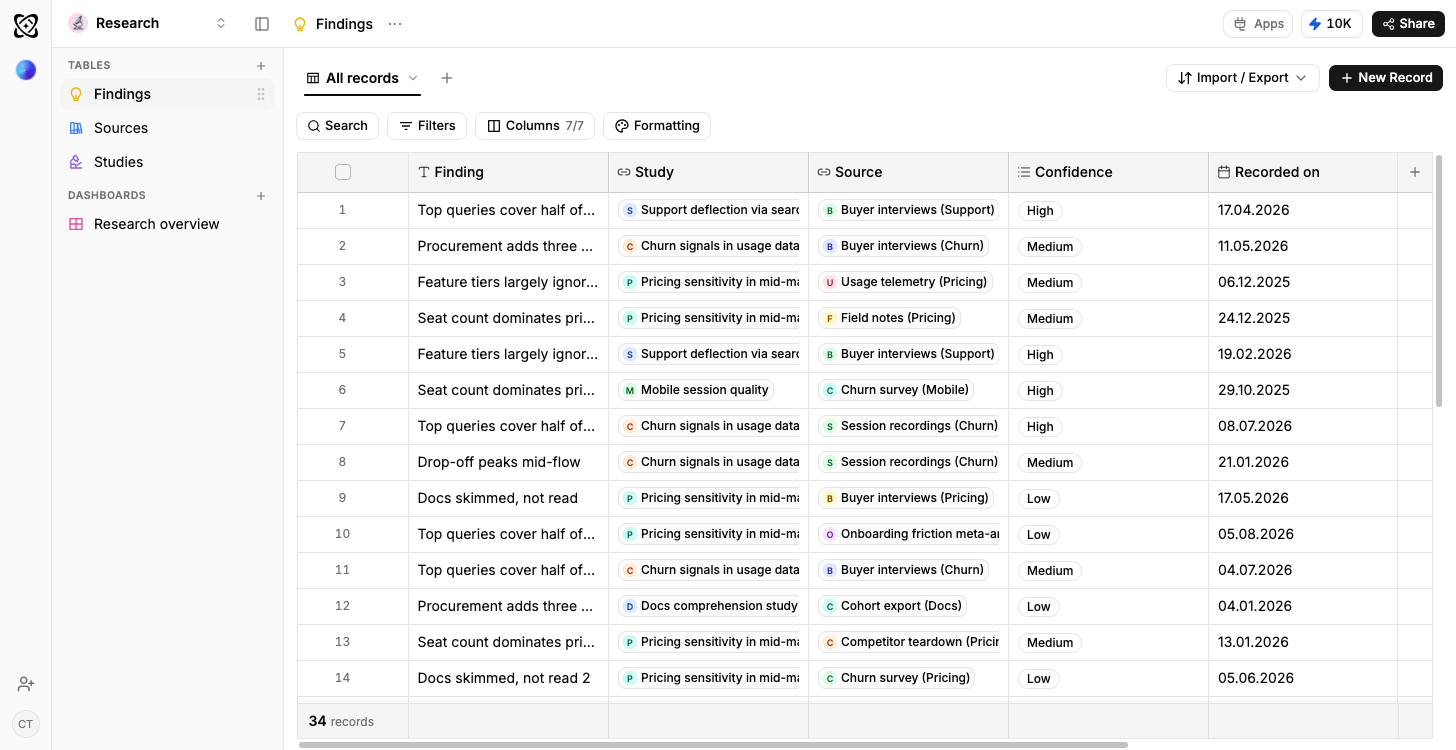
Research
Findings per theme, by confidence and source
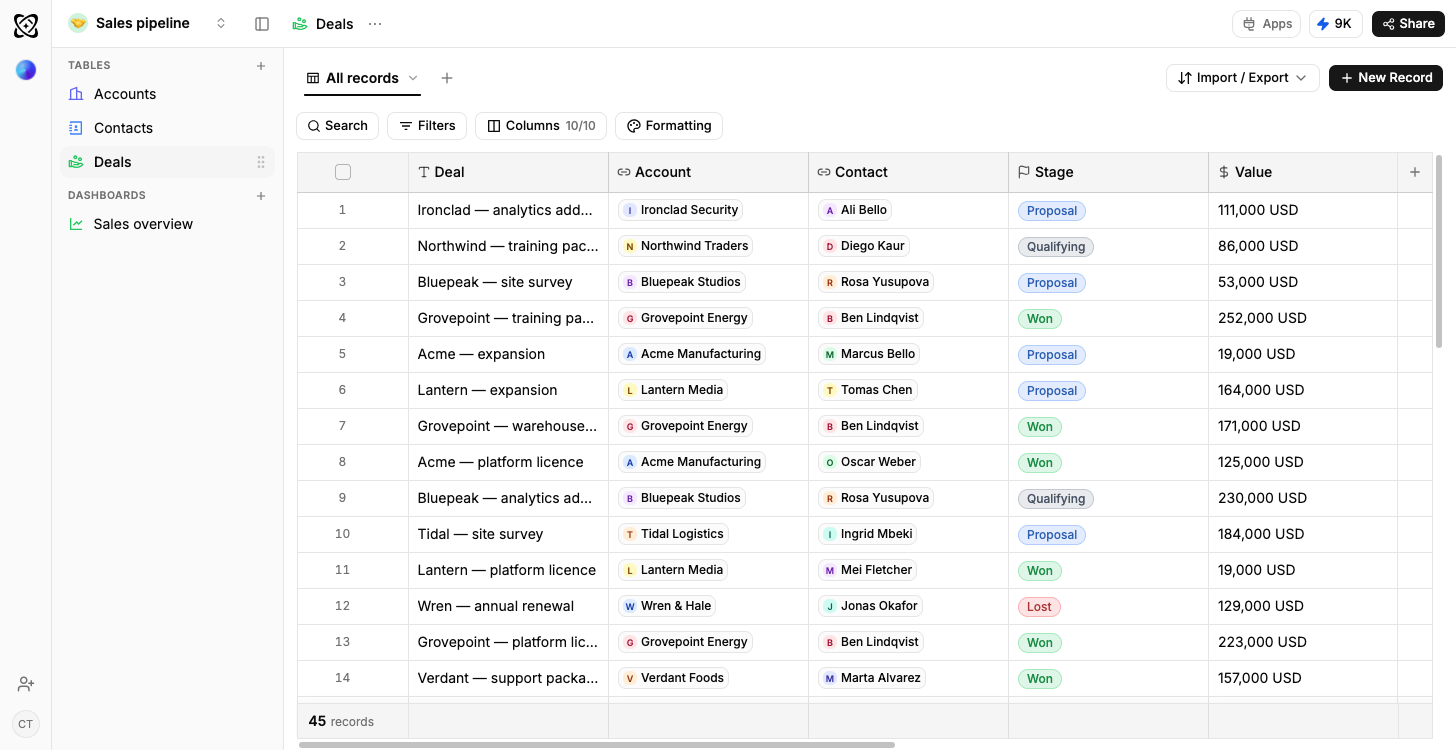
Sales pipeline
Open pipeline by stage, results by owner
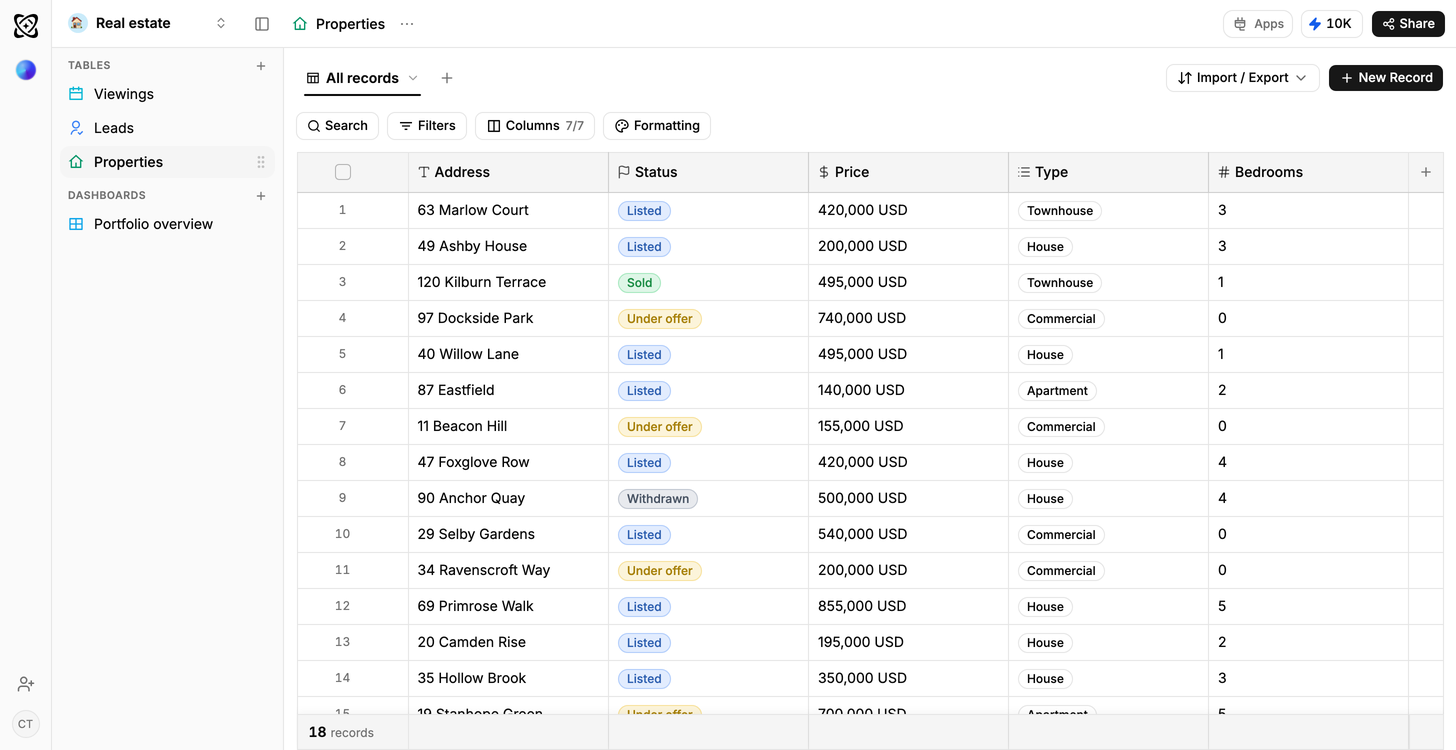
Real estate
Portfolio value and leads, by stage
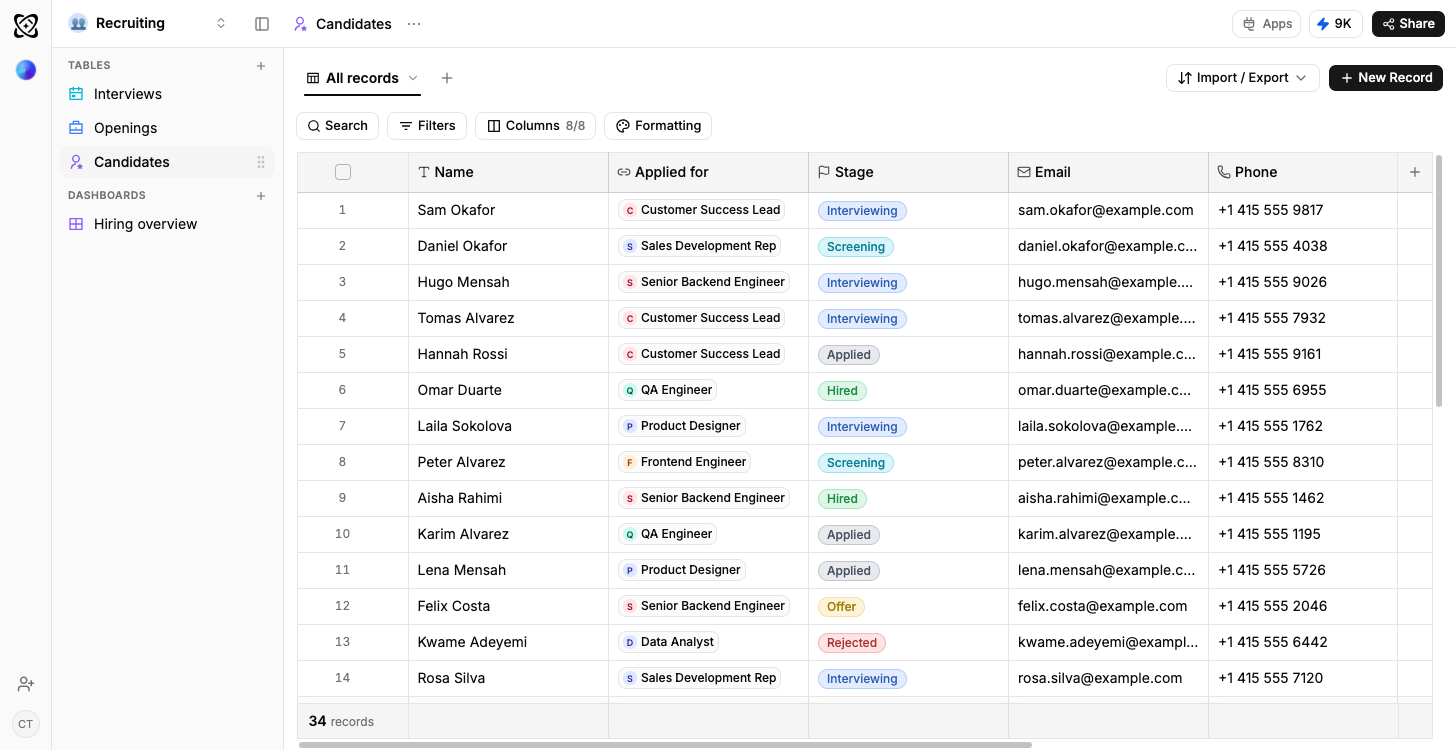
Recruiting
Candidates by stage, openings by status
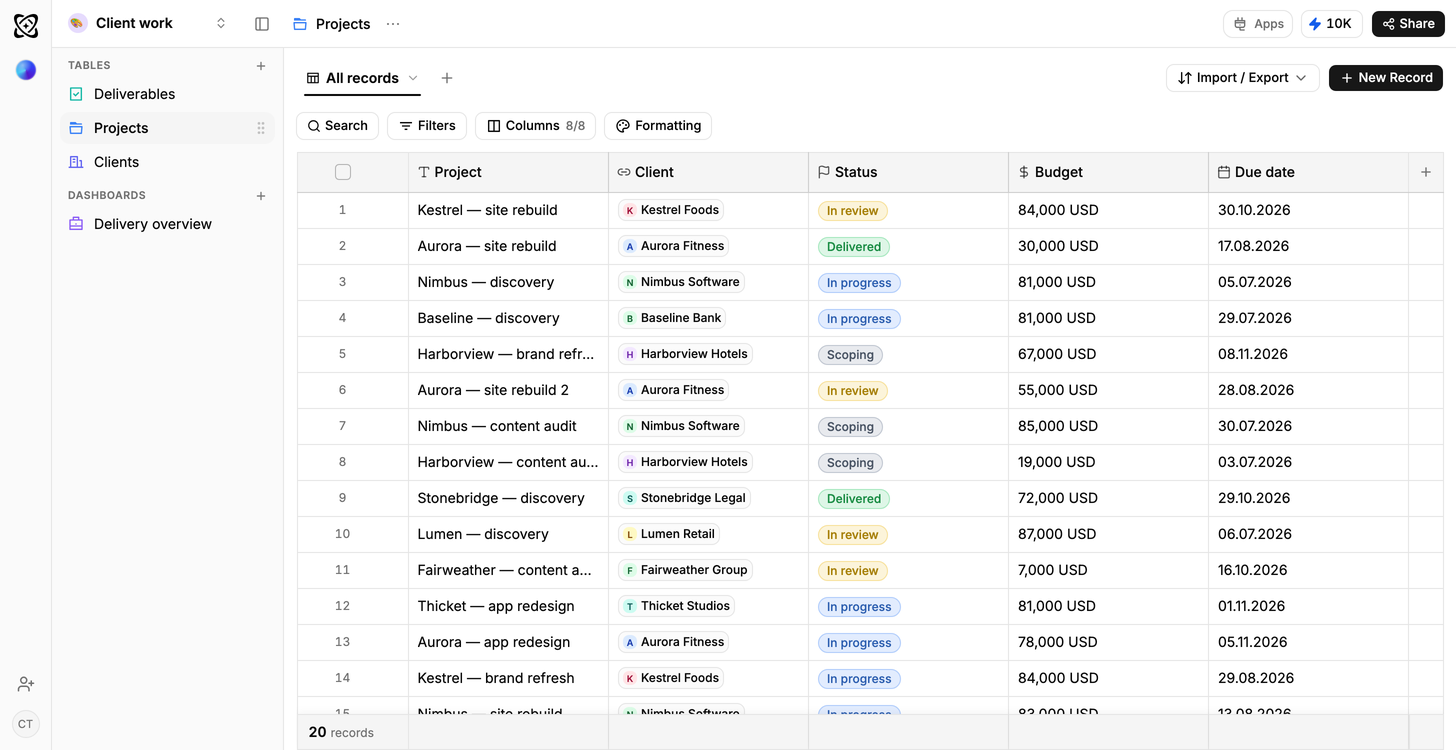
Client work
Due this week; shipped but not billed
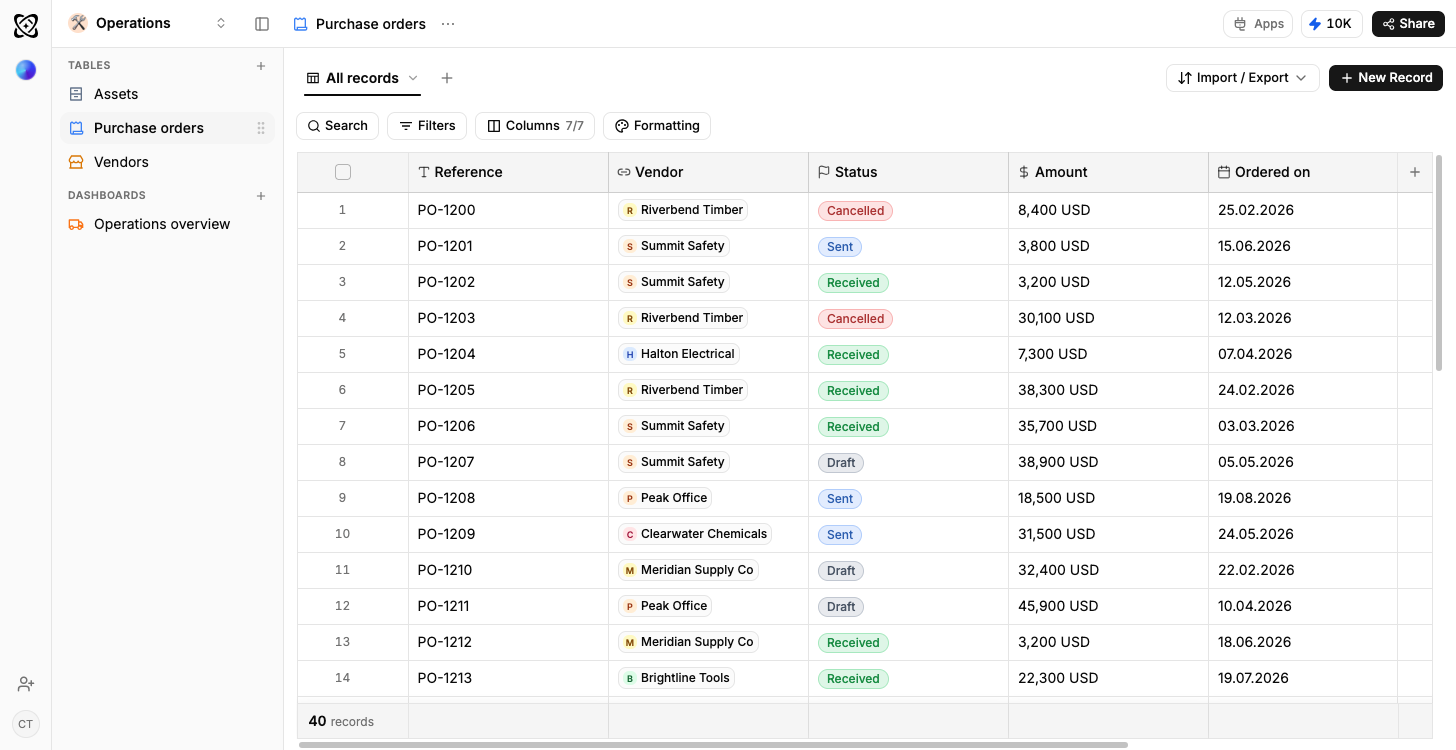
Operations
Orders in flight, spend by supplier
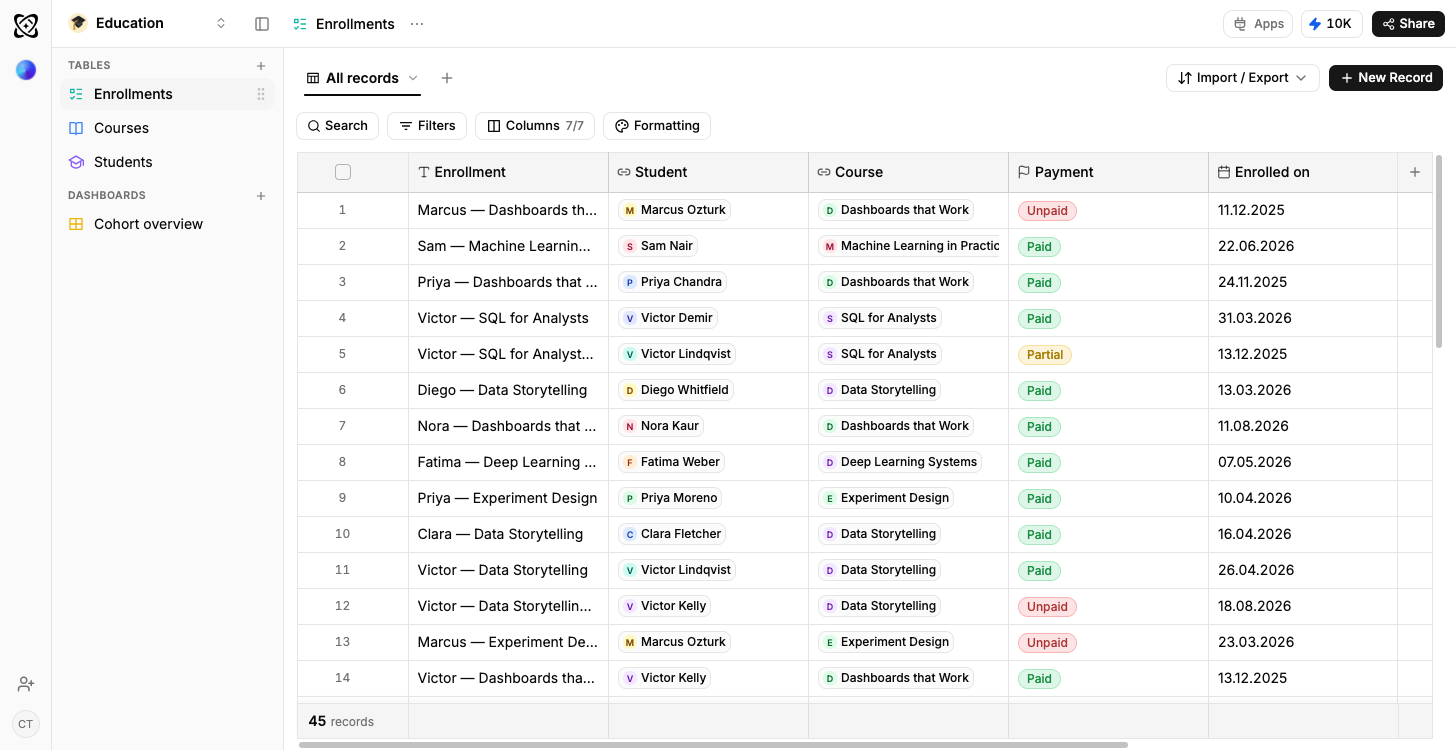
Education
Attendance and completion by cohort
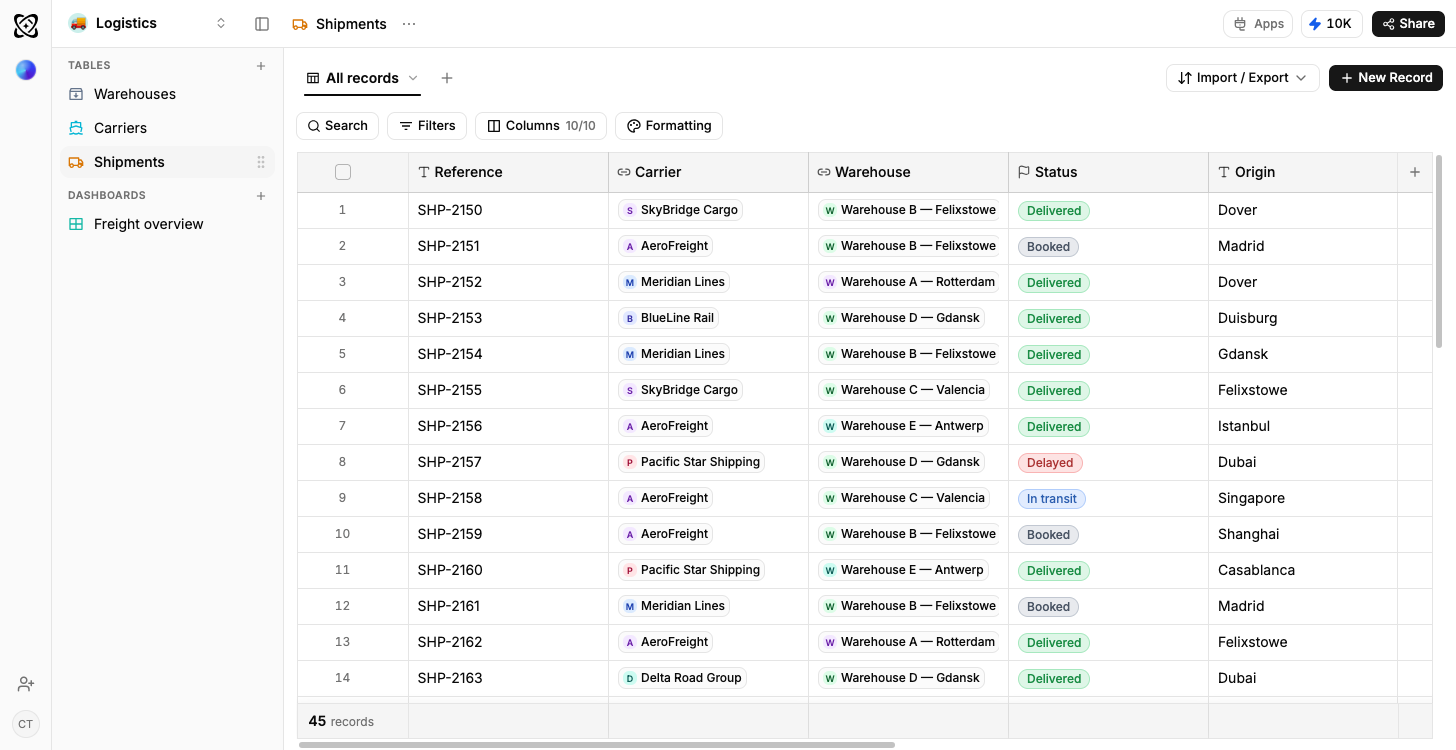
Logistics
On-time rate by carrier and lane