
A spreadsheet guesses what your data means. A database knows.
Typed columns, real relationships, and totals that stay right: dashboards, workflows and assistant answers read the same tables.
The column decides what the chart can say
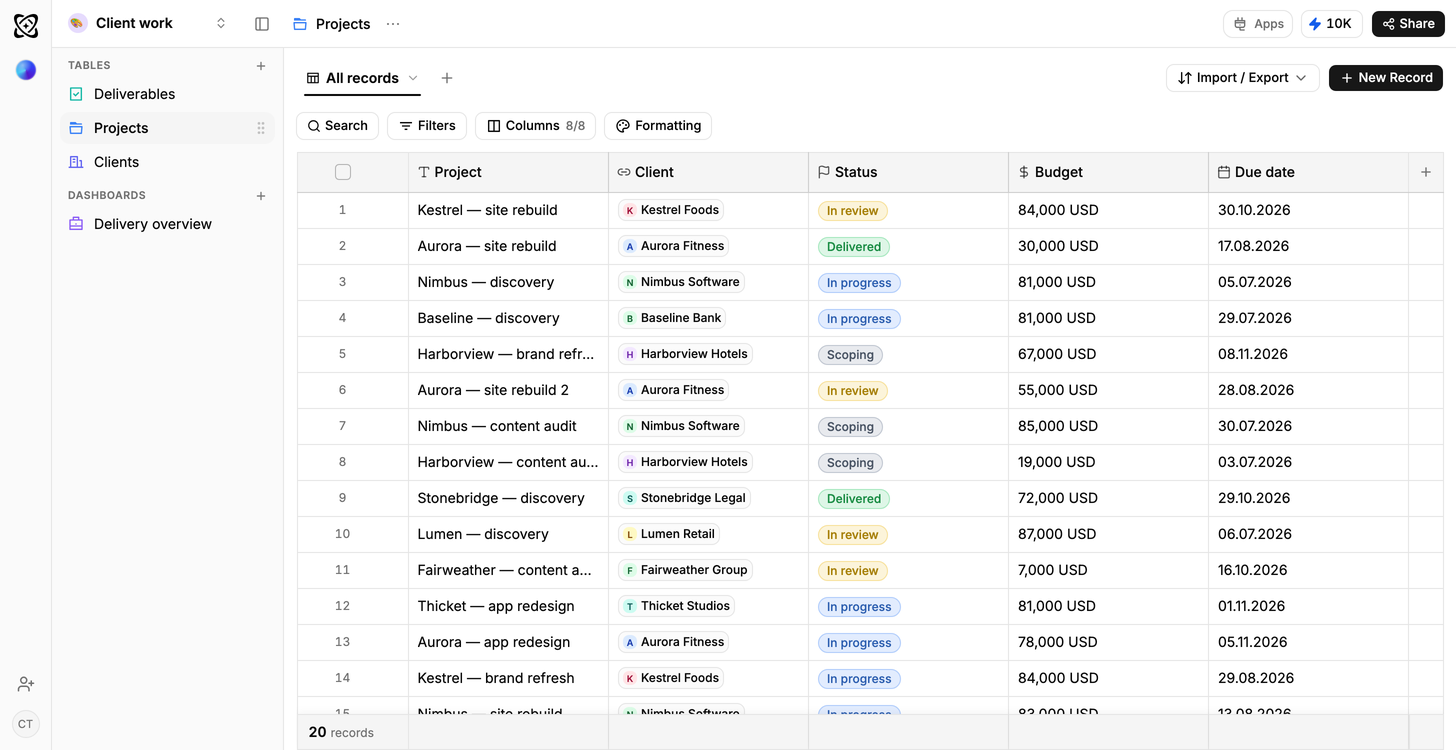
Columns that declare what they hold
Budget is currency, due date is a date, status is one of four. The total under the column is a total rather than a guess: nothing is quietly skipped because one person typed a comma and another typed a currency code.
Rows that point at rows
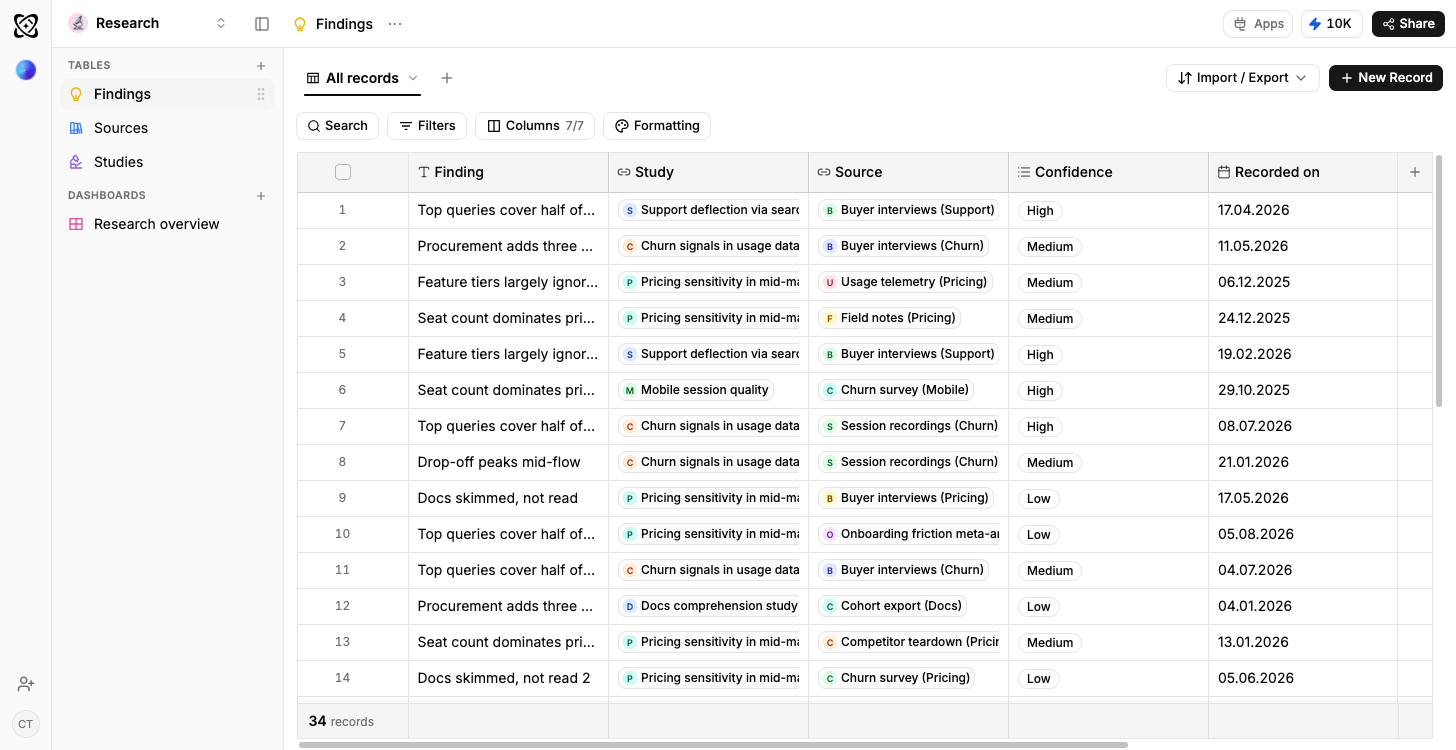
A finding points at the study it came from and the source it was read in. Not copied names: links, so a study can count its findings and a source can show what was drawn from it, with no lookup formula in between to break when somebody inserts a row.
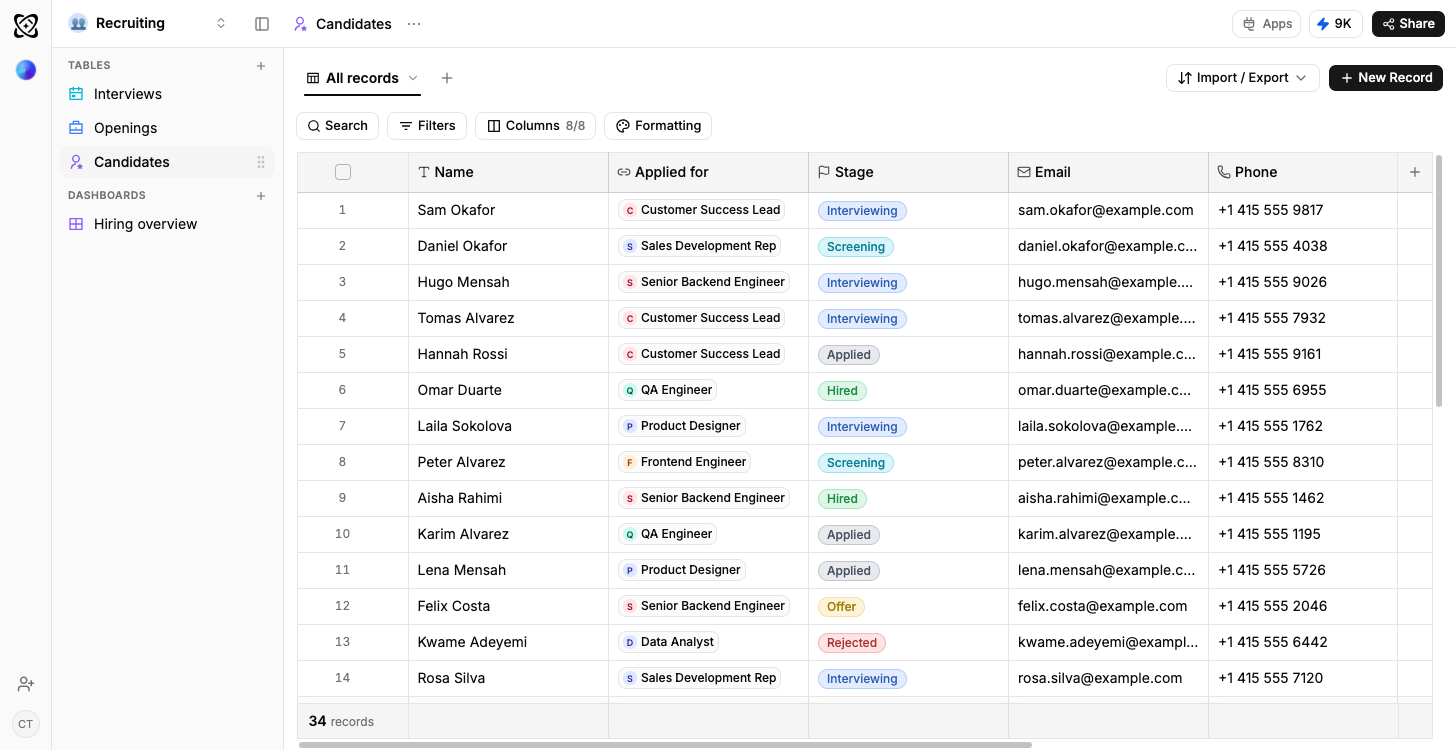
A stage is a list, not a spelling
Stage is a select: Applied, Screening, Interviewing, Offer, Hired, Rejected. Six options and six buckets. Nobody adds a seventh by typing one of them with a space on the end, so nothing has to be cleaned before it can be counted.
The chart is the same table, counted
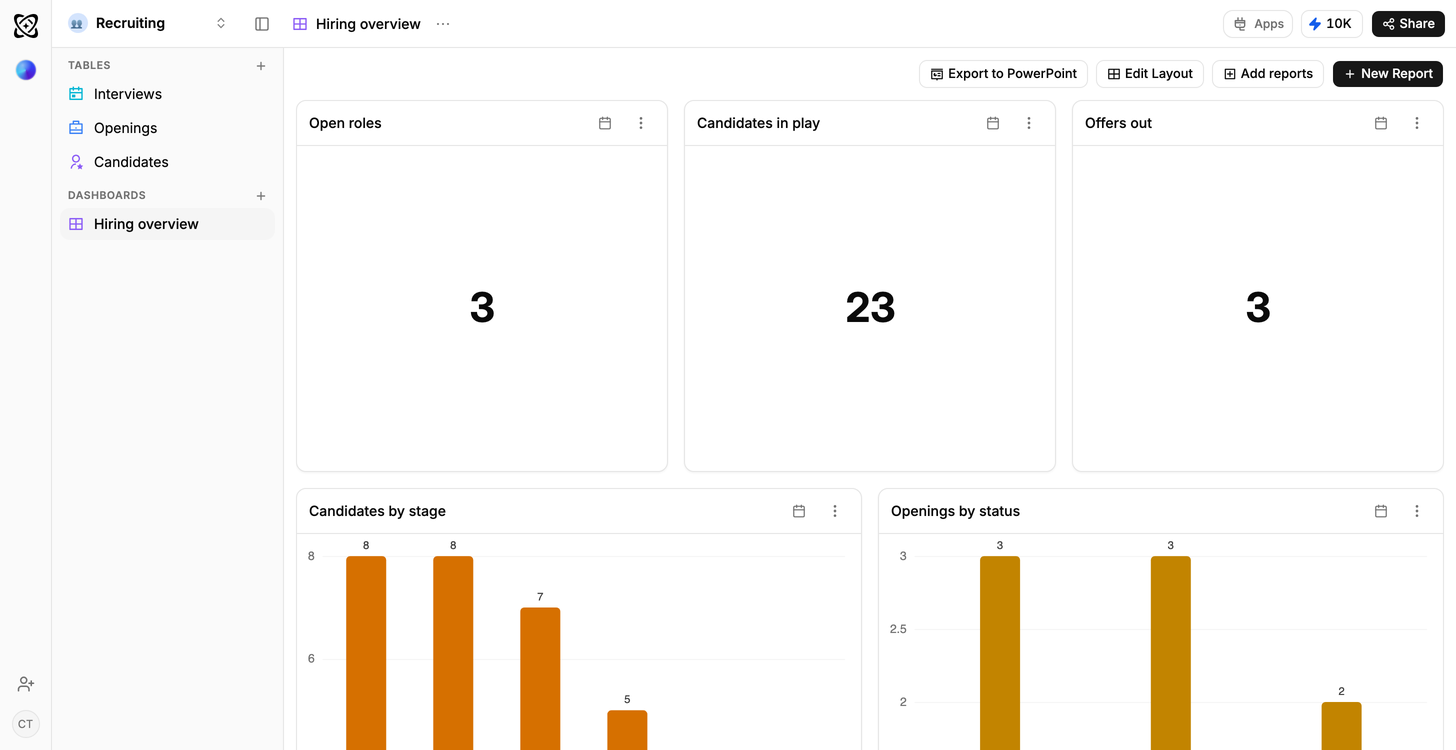
Candidates by stage is that select column, counted. Openings by status is another one. There is no export and no second copy of anything: move a candidate to Offer in the table and the bar has already moved.
Frequently asked questions
Nothing is locked in, describe the change and Ferra applies it to the column and to the rows already in it.
No, and deliberately. Headers and values become typed columns; merged cells, colour coding and margin notes are not data a chart can read.
Yes: every table exports, and the export is the same rows you can see.
A table of ten thousand rows behaves like the thirty-four-row one above: same types, same filtering, same charts. The AI app builder page shows one.
No. Describe what you track and Ferra proposes the tables, the columns and the links, then asks about the parts it had to guess. See the AI app builder for what that looks like end to end.
It fills them. A formula is a column, not a one-off calculation, so it computes for every row in the table and keeps computing as rows change.
Yes: no separate index or synced copy. The assistant reads these tables and tells you which ones.