
Stop rebuilding the same marketing report every month
Campaigns, channels and content in one workspace: charted off the rows your team already edits, not off five exports stitched together.
What marketing teams build with Ferra
Channel dashboards
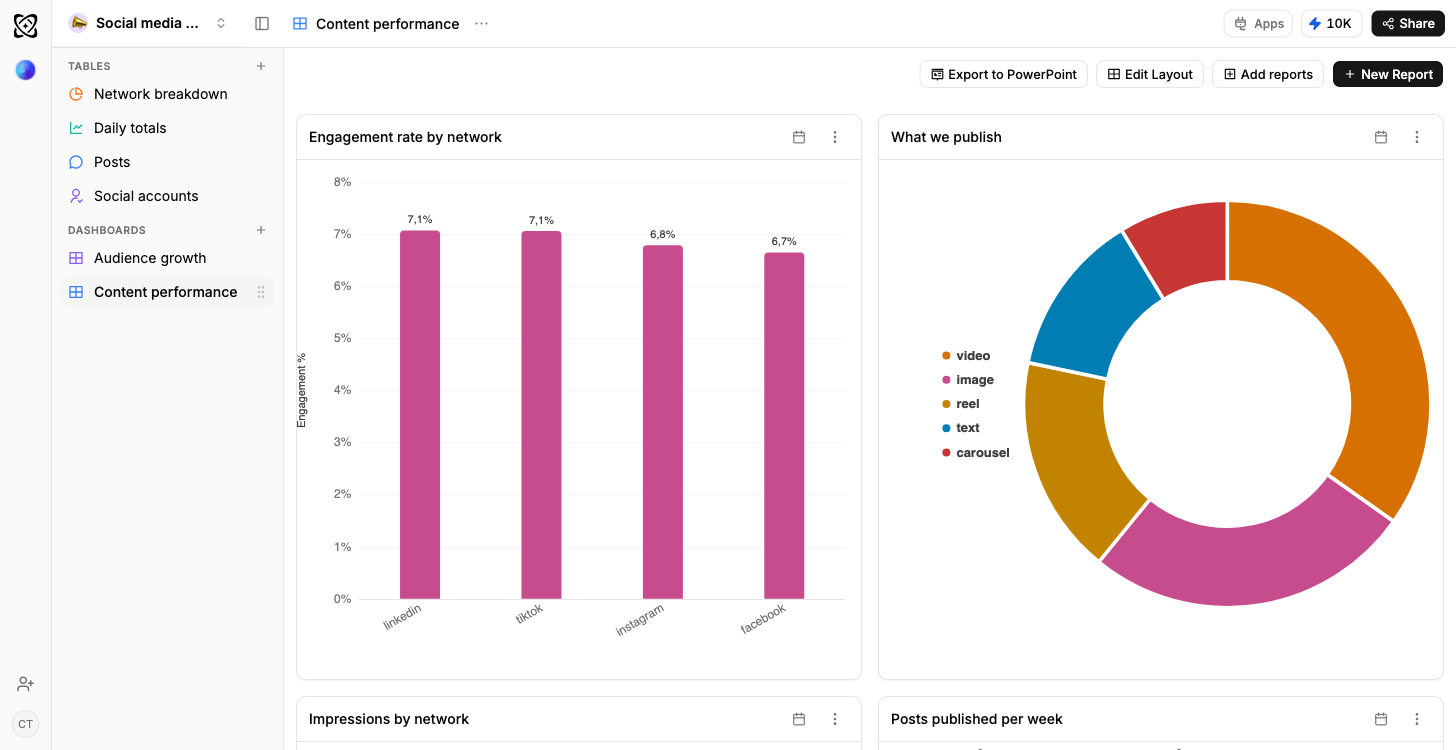
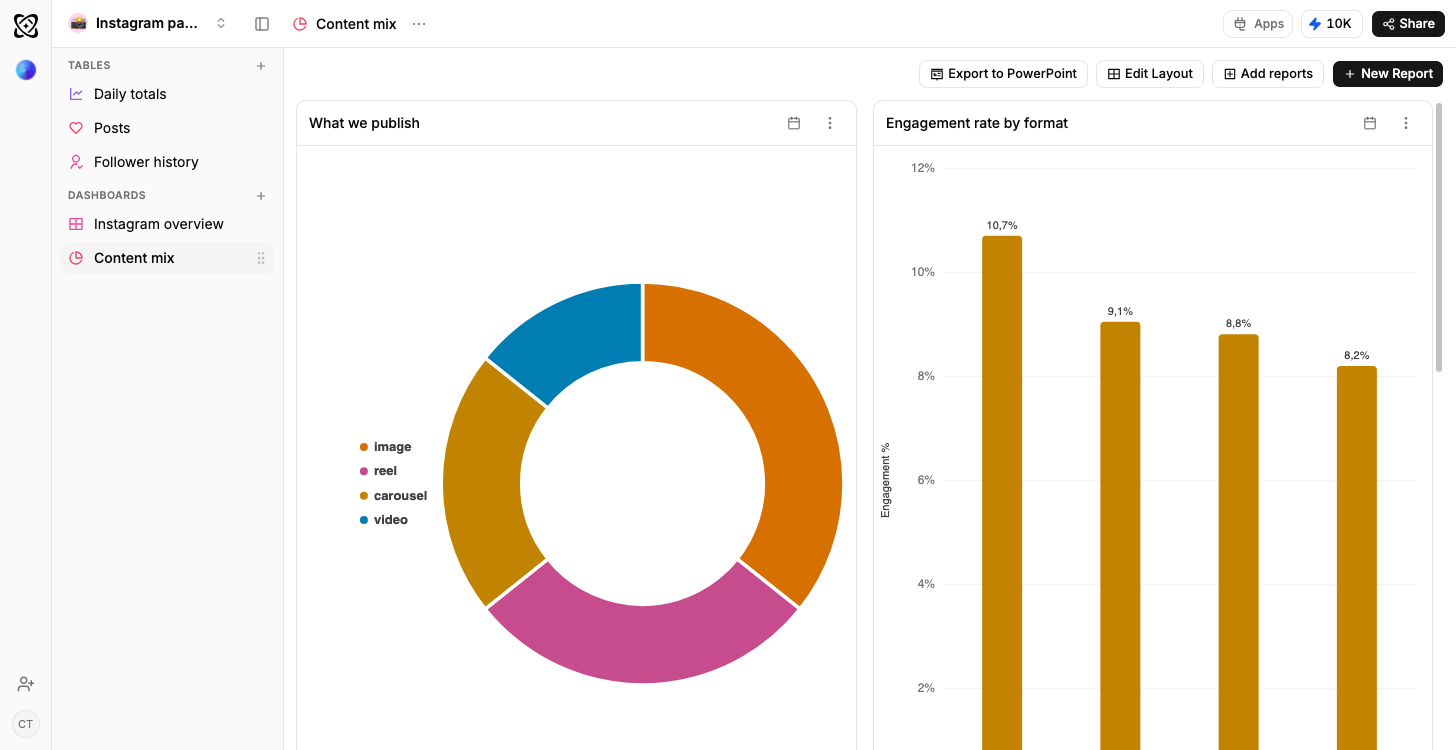
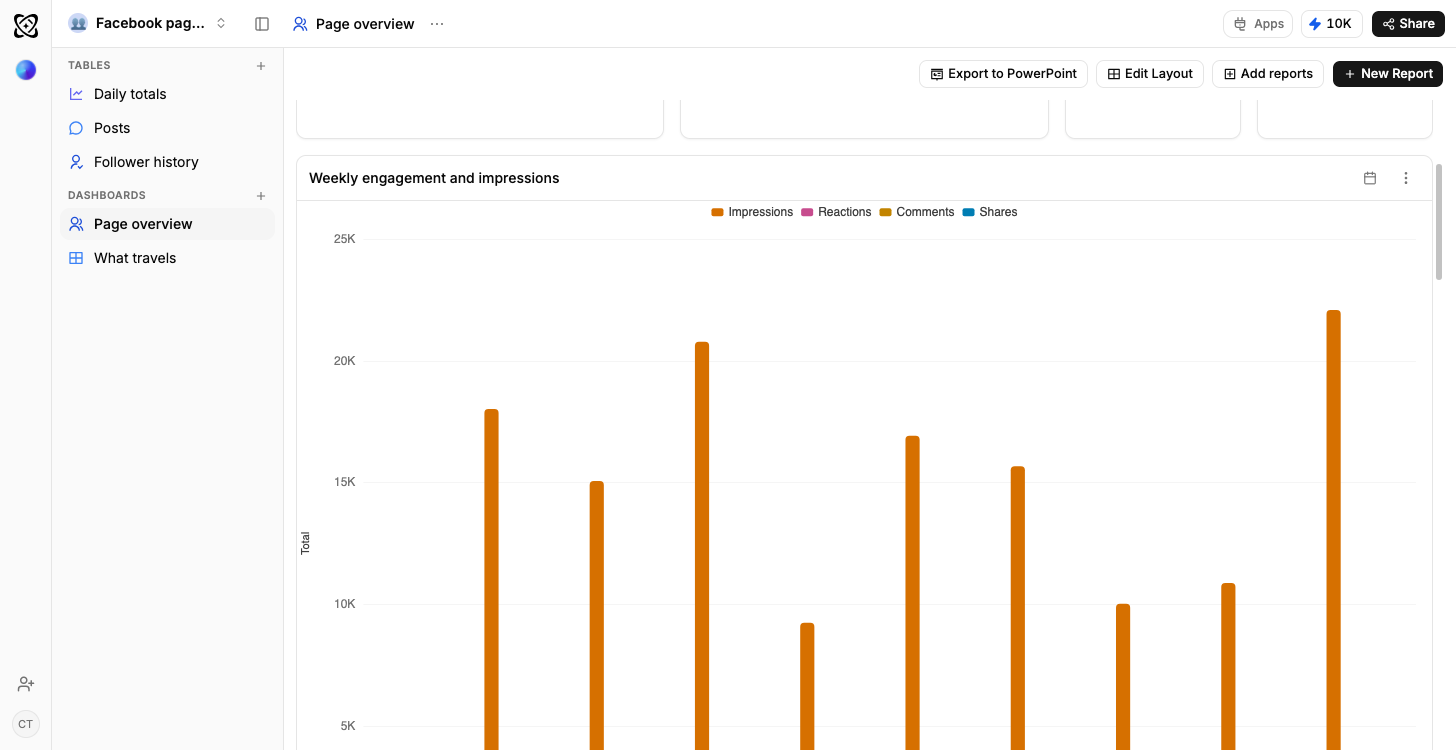
Every channel beside every other one, engagement, spend, cost per result, in a view that reads the rows your team is already editing.
The table underneath
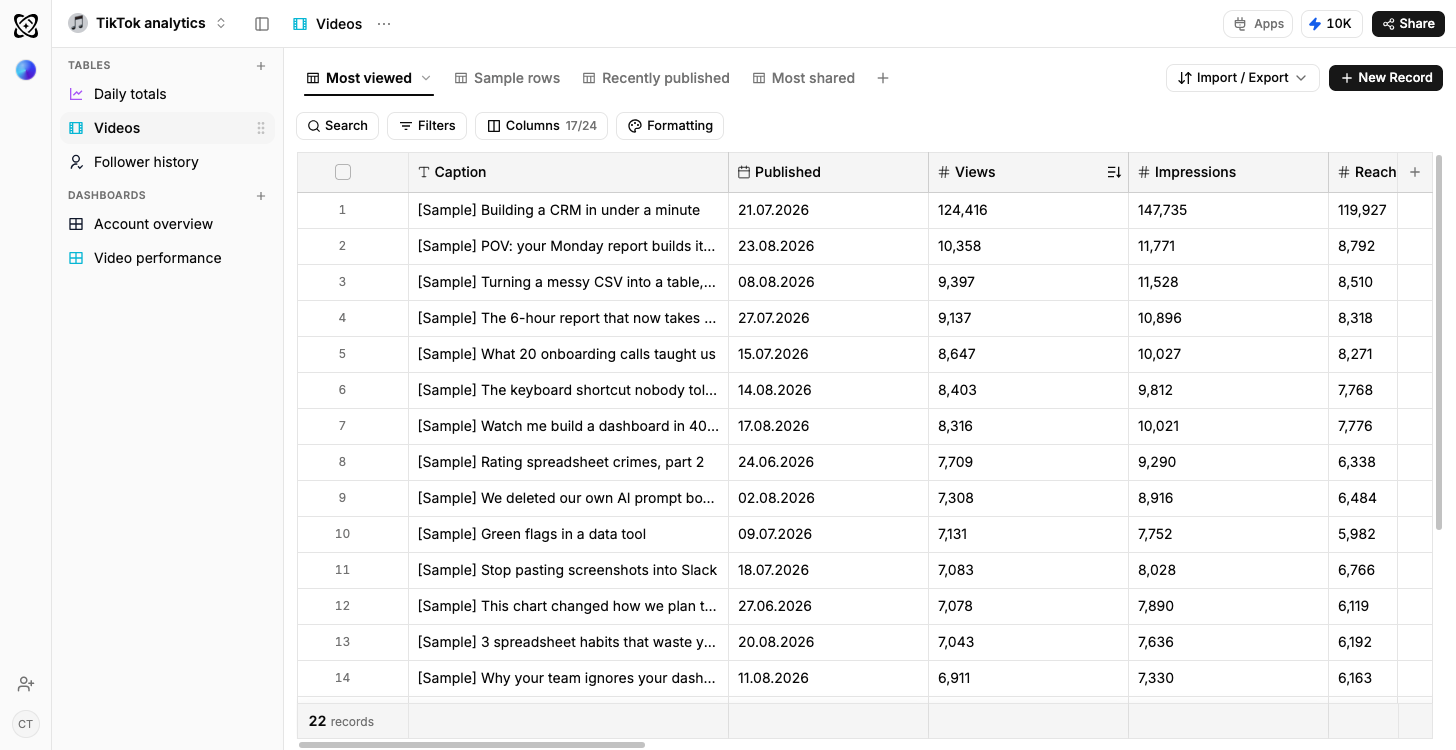
Every chart points at a real table. Sort it, filter it, correct a number in it: the dashboard has already moved.
Growth as a line
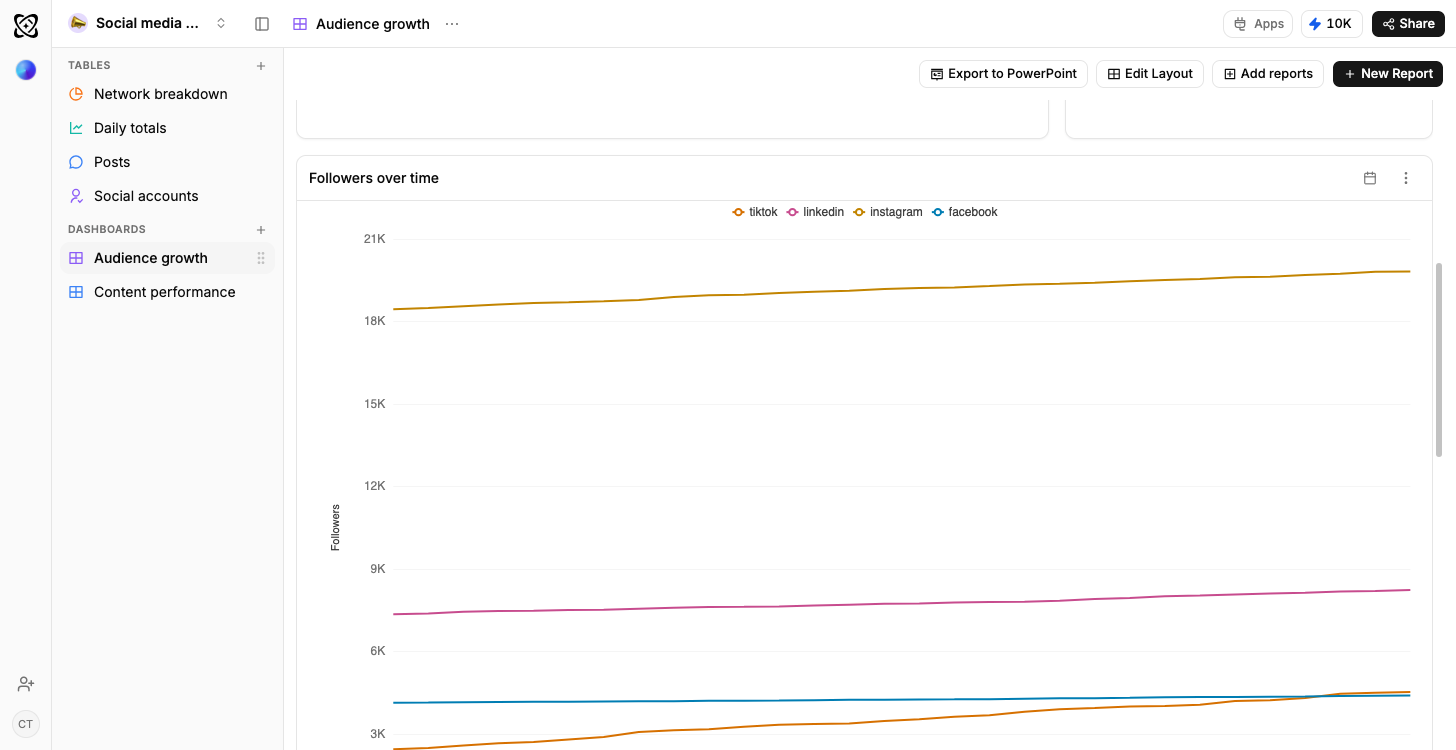
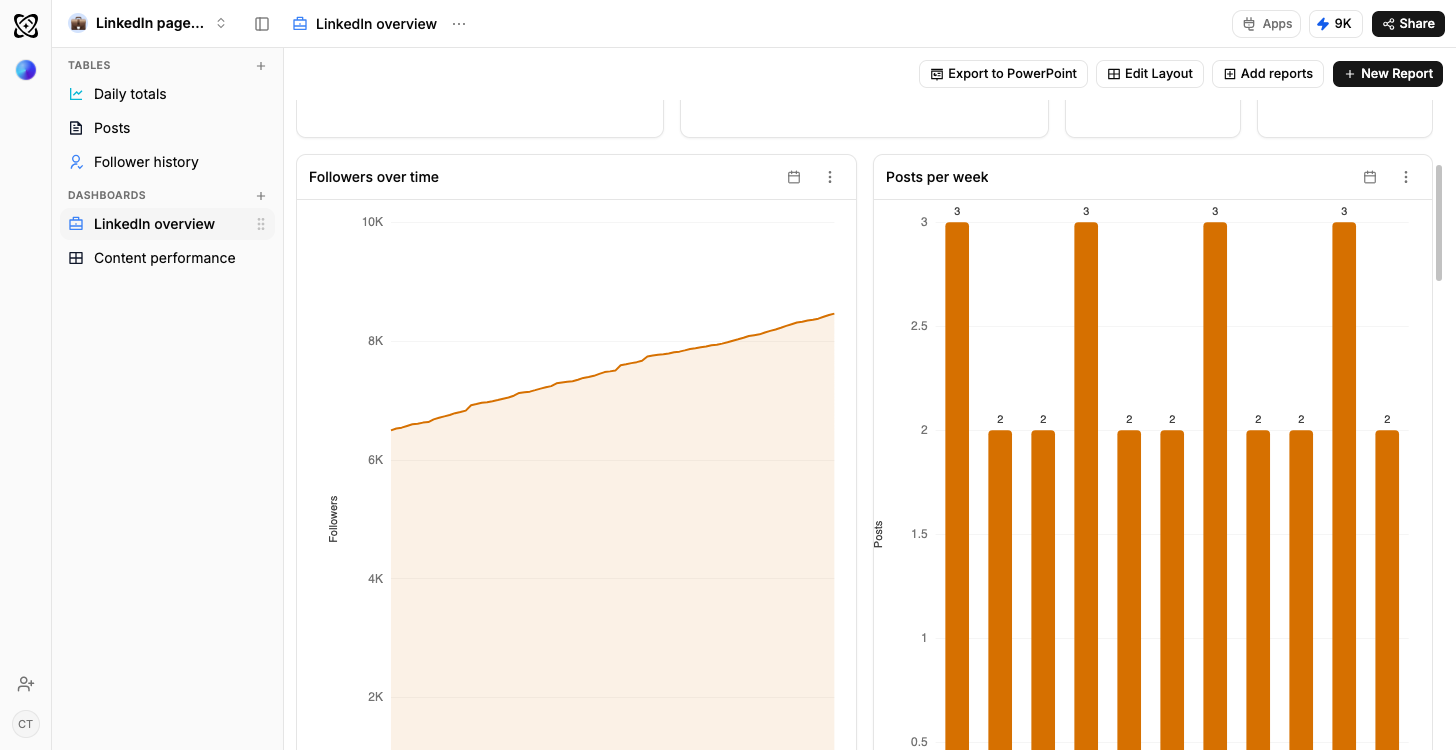
Follower history is its own table, so growth is four networks on one chart rather than a number somebody remembers from last month.
The column you are missing
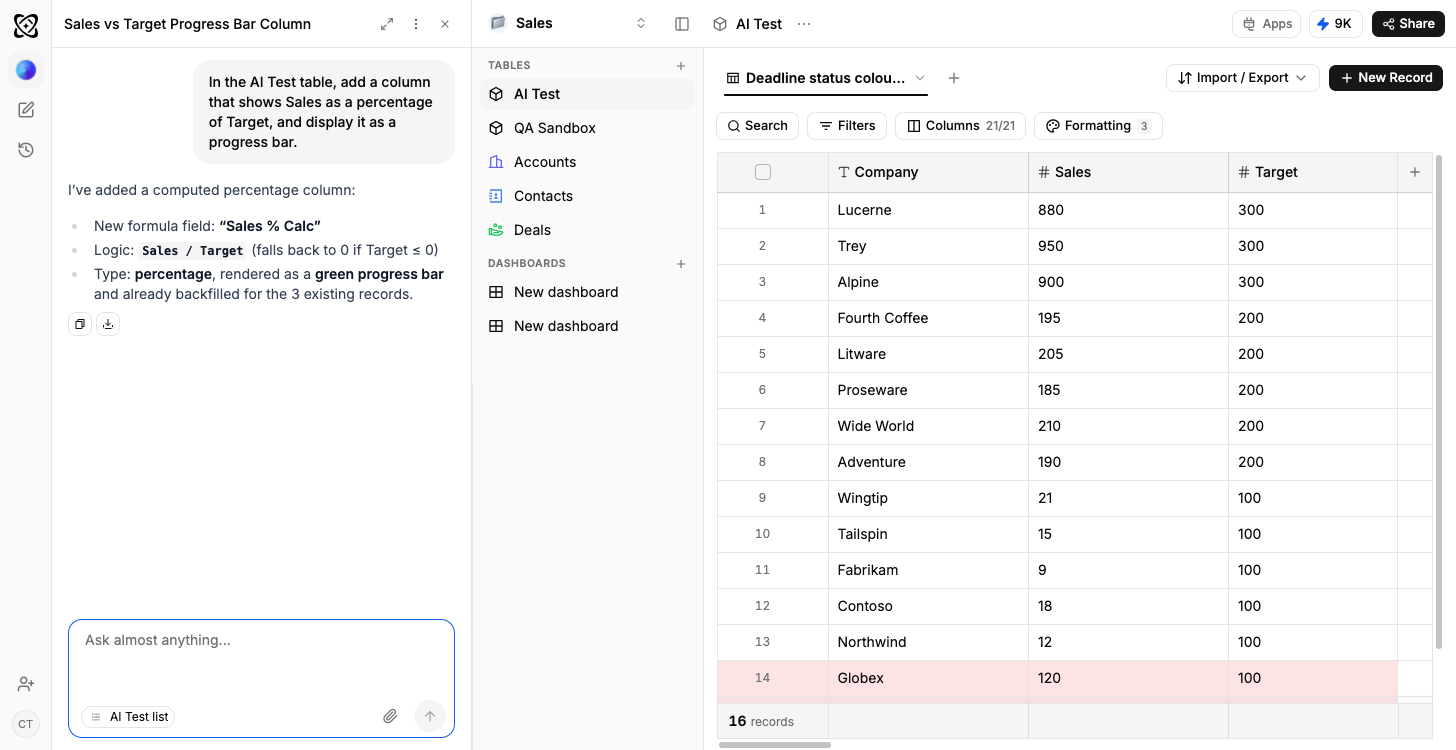
Ask for cost per acquisition and Ferra writes the formula, adds the column, and backfills the rows you already have.
Pick your channel, the dashboard is already built
Pick one and sign up free. It opens working: sample rows in the tables, dashboards already drawing.
- TikTok
- YouTube
Social media analytics
Every channel in one place: posts, reach and engagement side by side, with a cross-platform performance dashboard.
4 tables2 dashboardssample data included
Use template





One account at a time
Frequently asked questions
No. Upload the CSV or XLSX, or connect the Google Sheet: rows match your existing campaigns.
No. Describe what you report on. Ferra builds the tables and columns. Changing your mind is a sentence, not a migration.
They land as separate rows. Rename one, or ask the assistant to align them: existing rows update too.
Yes: a workspace is shared, dashboards included. A workflow can send the numbers to Slack, Telegram, WhatsApp or email on a schedule.