
The pipeline nobody has updated since Thursday
Say what happened and Ferra finds the deal, moves the stage and redraws the forecast, so the number you present is the one your reps edited this morning.
From the export to the forecast
Start from the sheet you already run
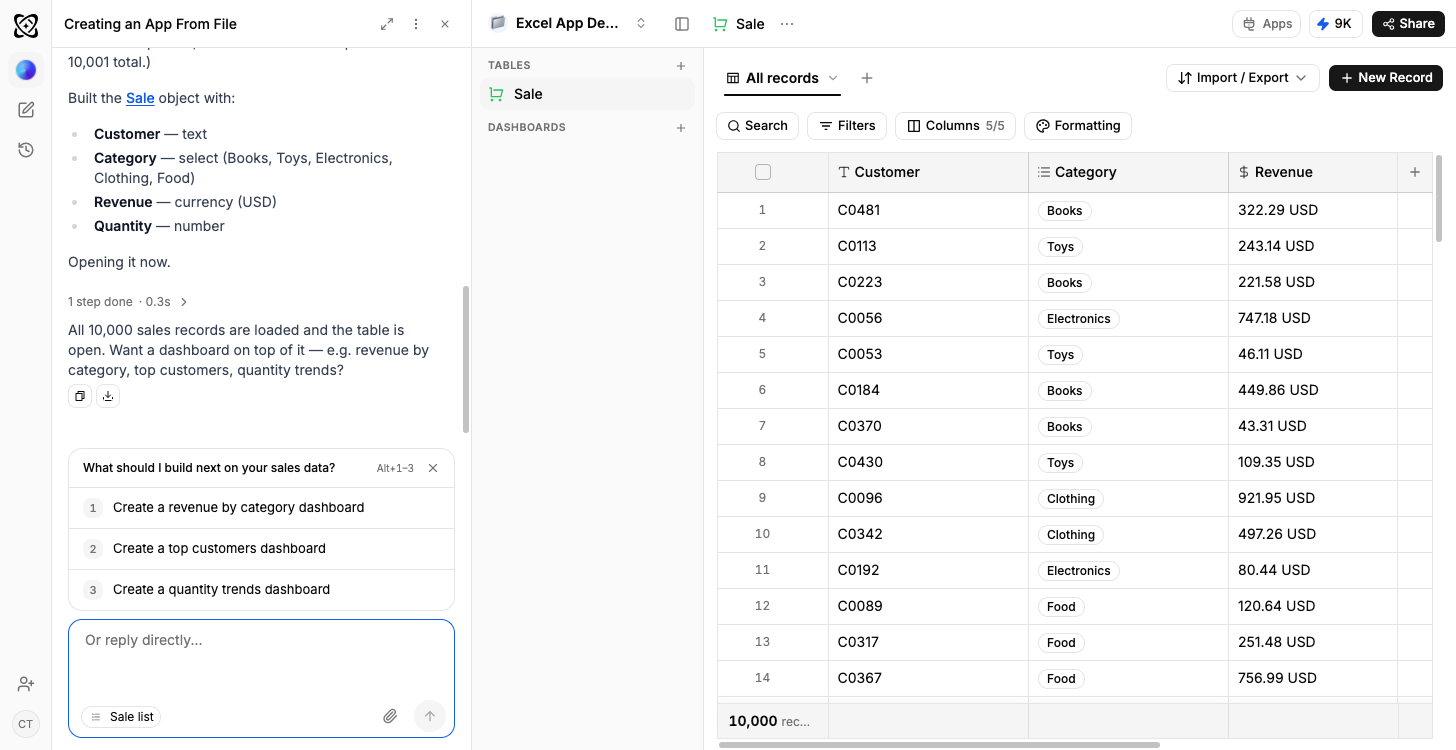
Upload the export and Ferra reads the rows in, then types every header for you: customer as text, category as a select, revenue as currency, quantity as a number.
Stage is a select, not a spelling
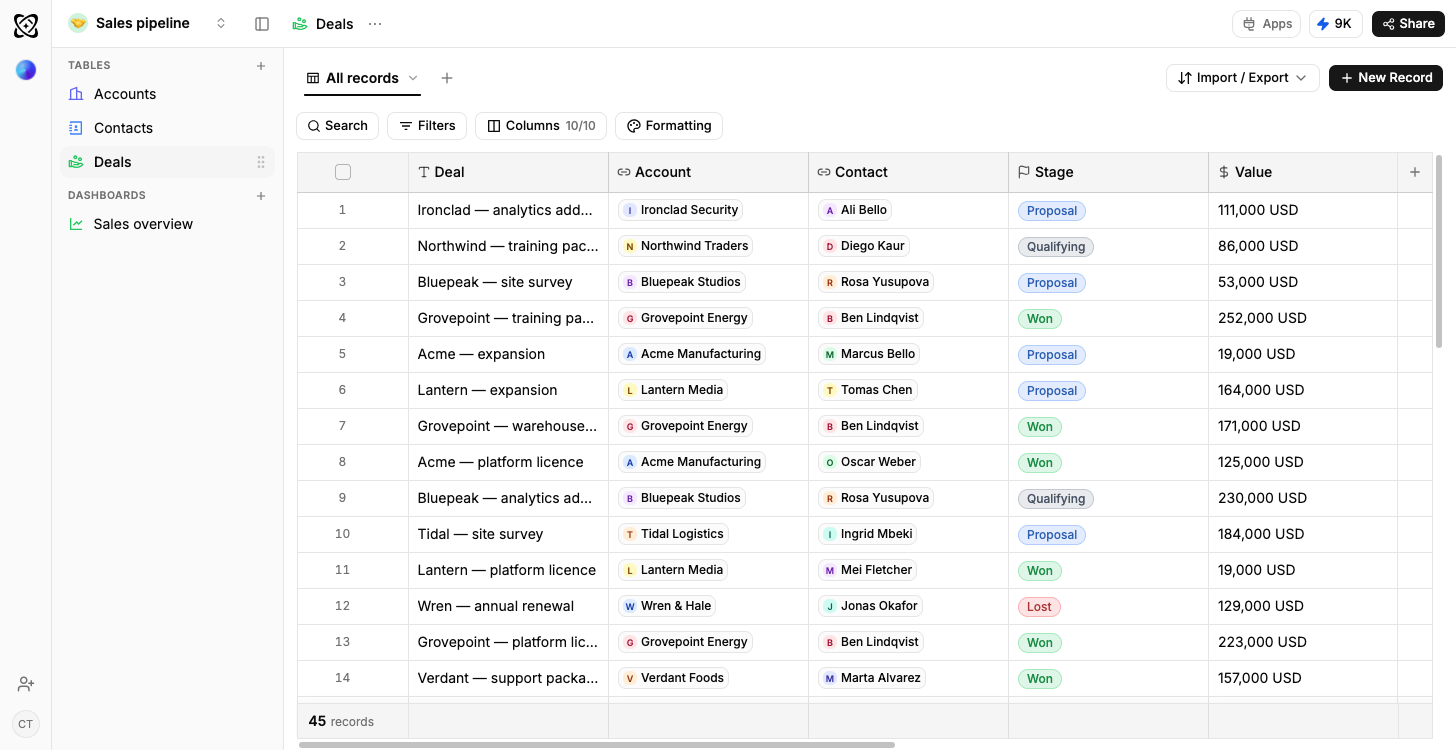
Every deal points at an account and a contact, and stage comes off a fixed list, so the breakdown has five bars rather than seven spellings of Proposal.
Open one and read what happened to it
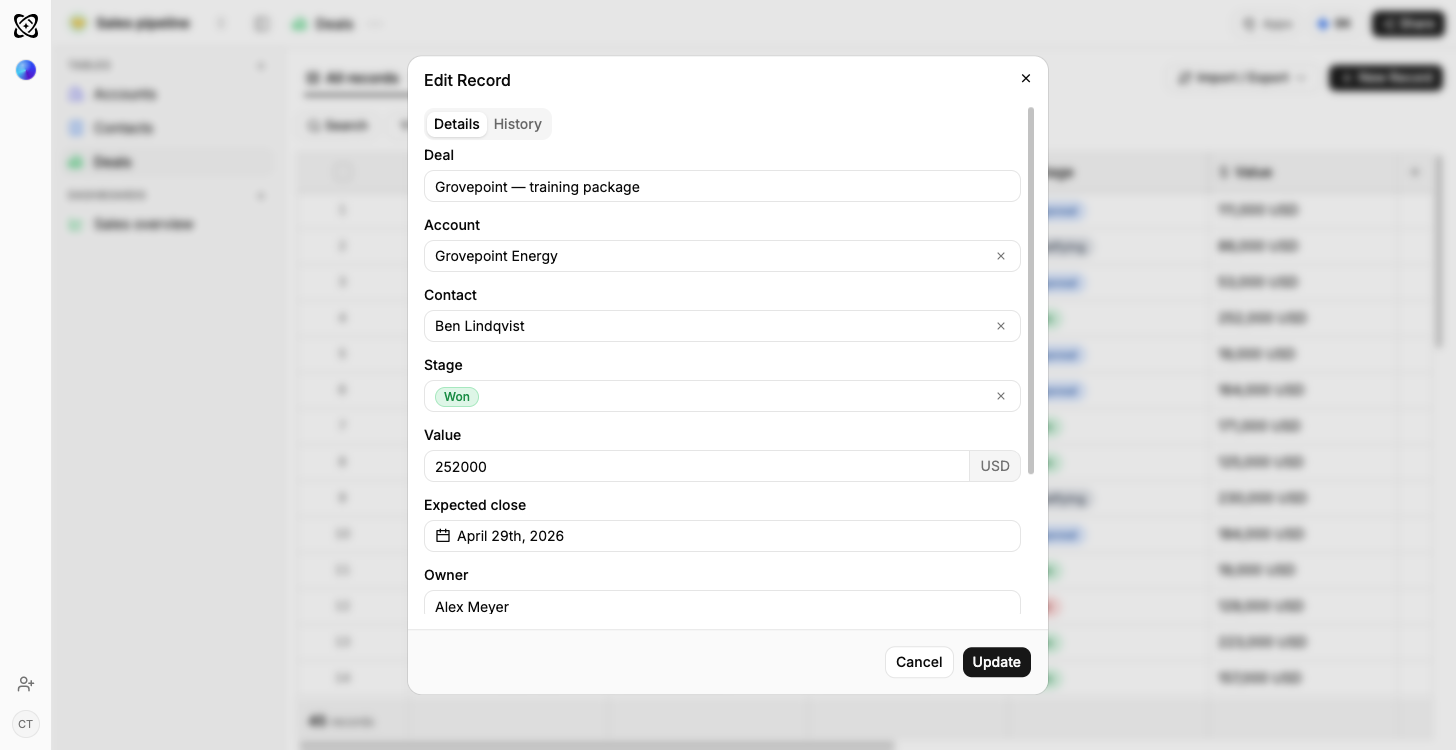
Value is currency, expected close is a date, owner is a person. History sits beside Details, so when a deal moved to Won is something the record knows rather than something someone remembers.
The forecast is drawn over those columns
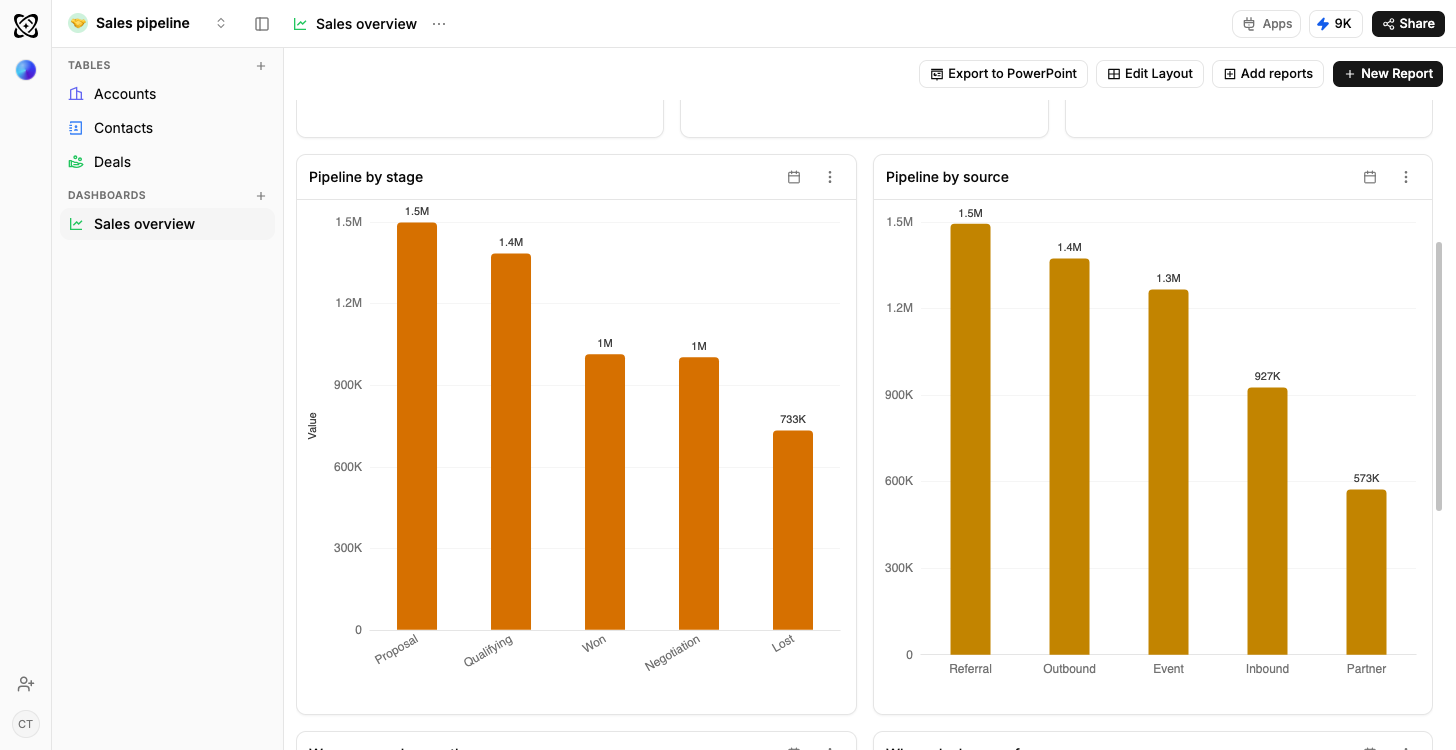
Pipeline by stage and by source, read straight off the deals table. Correct a value and the chart has already moved. There is no second copy of the numbers.
Your pipeline, already built
Sign up free and it opens working: linked tables, sample rows, dashboards already drawing.
Sales pipeline
Deals carry a stage and a value, contacts carry the people they belong to, and every call and demo is logged against the deal it moved. Open value by stage draws before you have entered a real row.
3 tables1 dashboardsample data included
See template
The same pipeline shape, other subjects
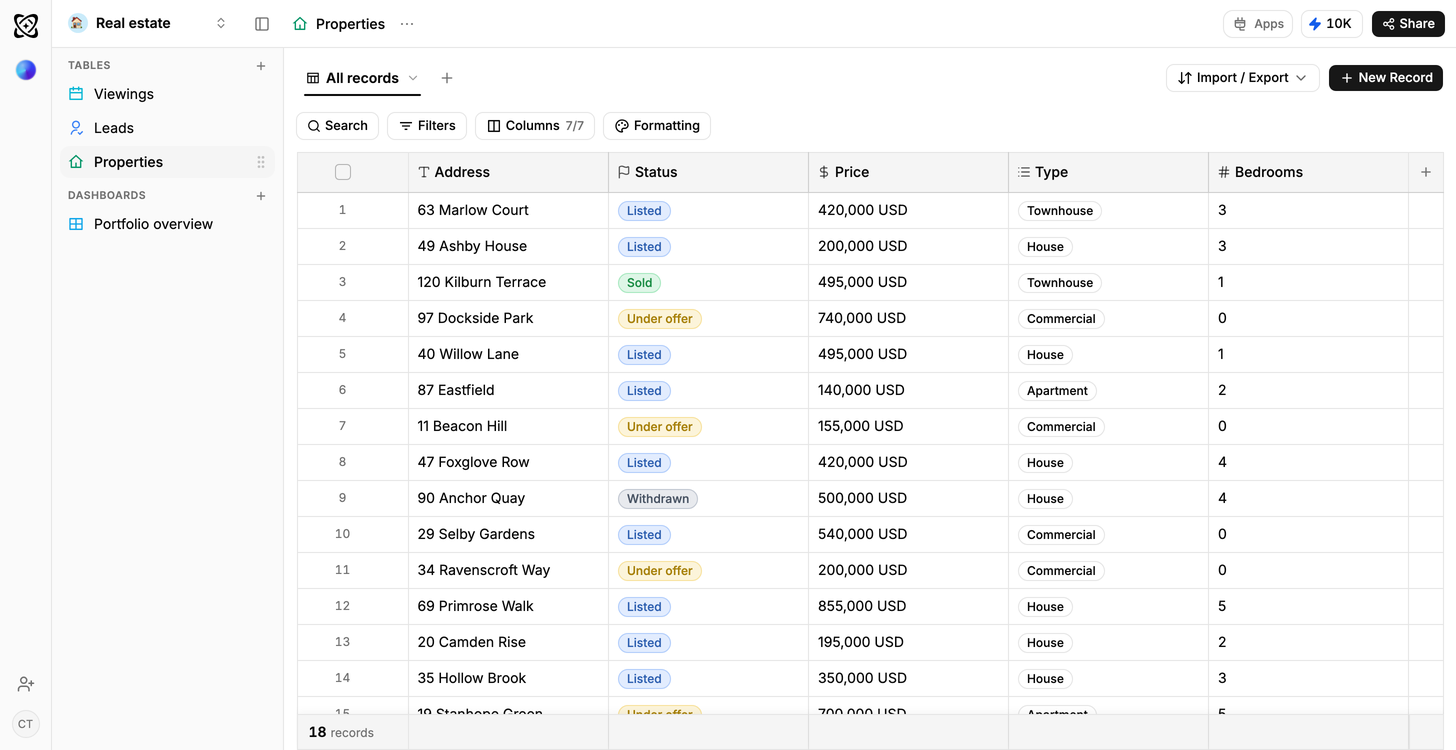
Real estate
Portfolio value and leads, by stage
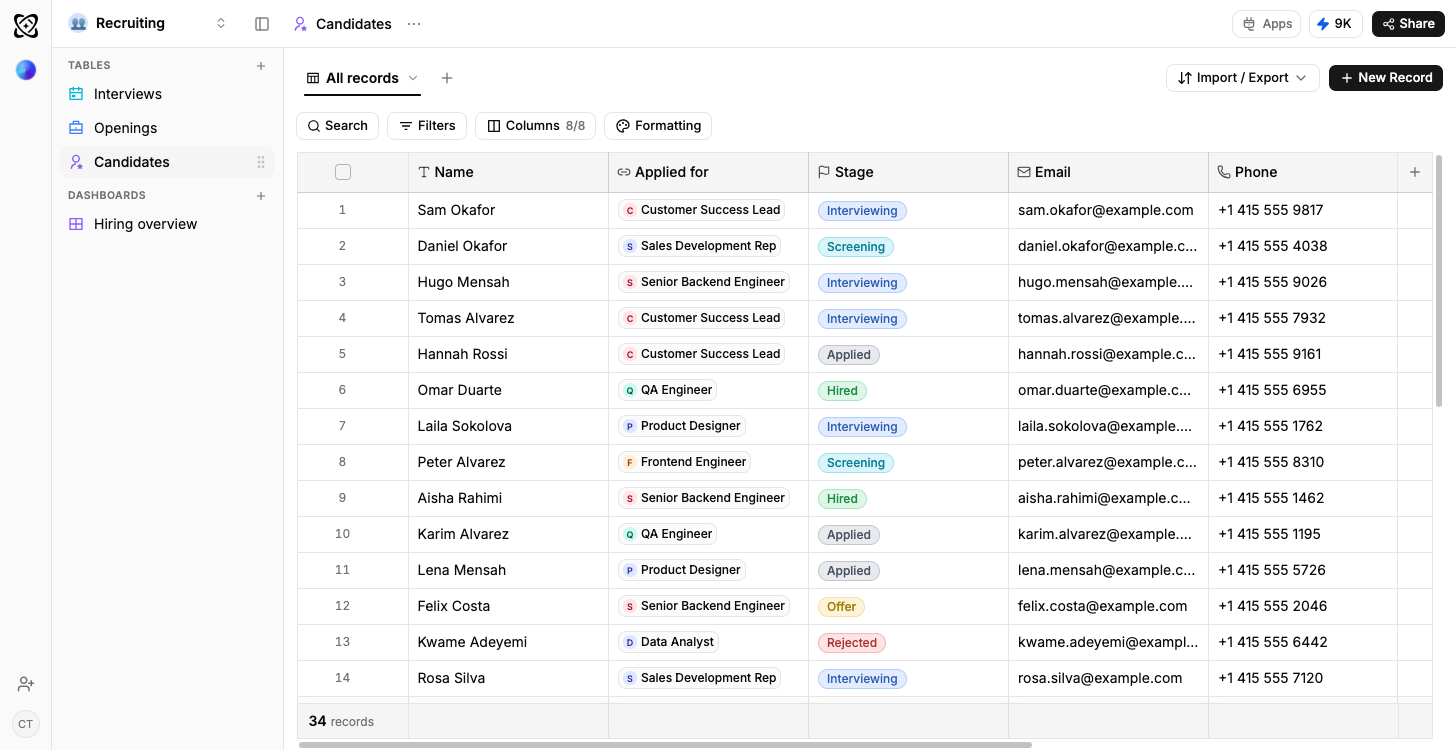
Recruiting
Candidates by stage, openings by status
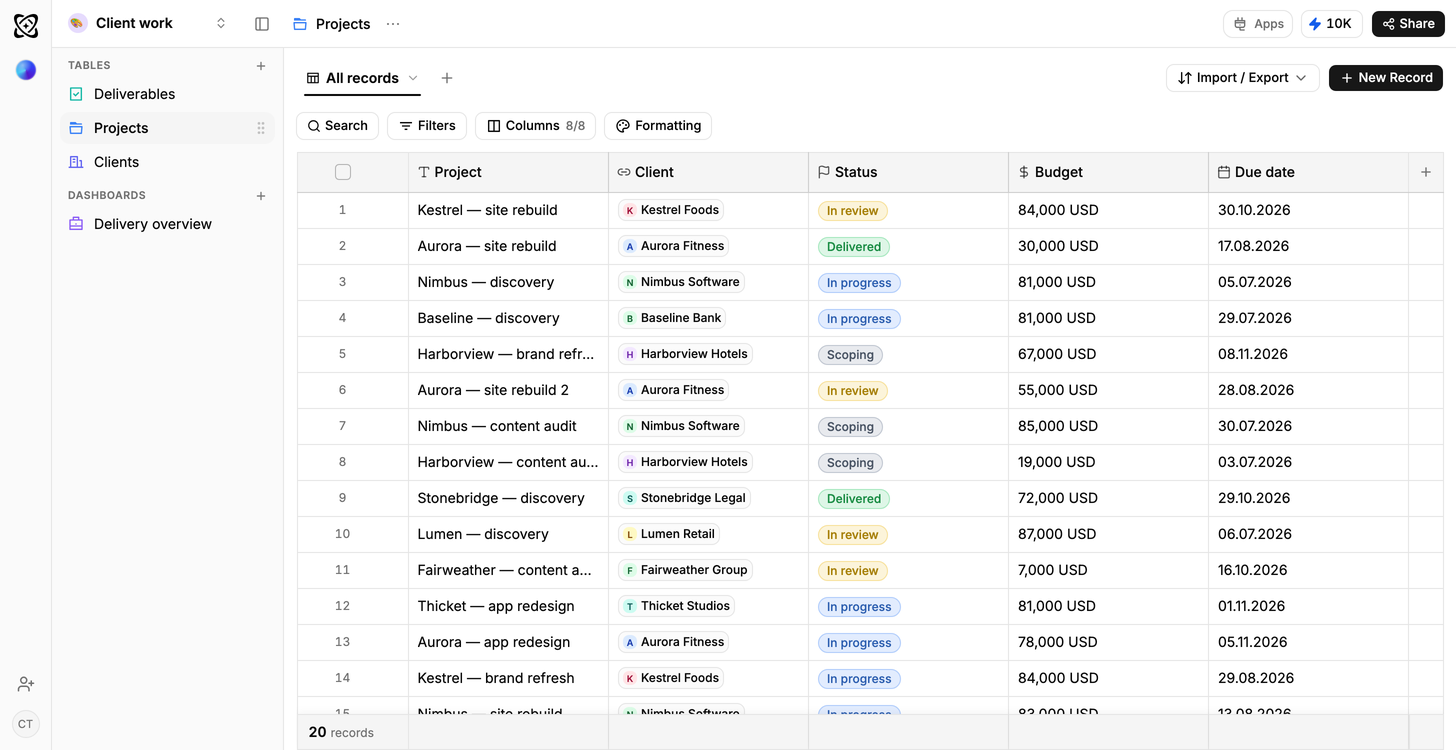
Client work
Due this week; shipped but not billed
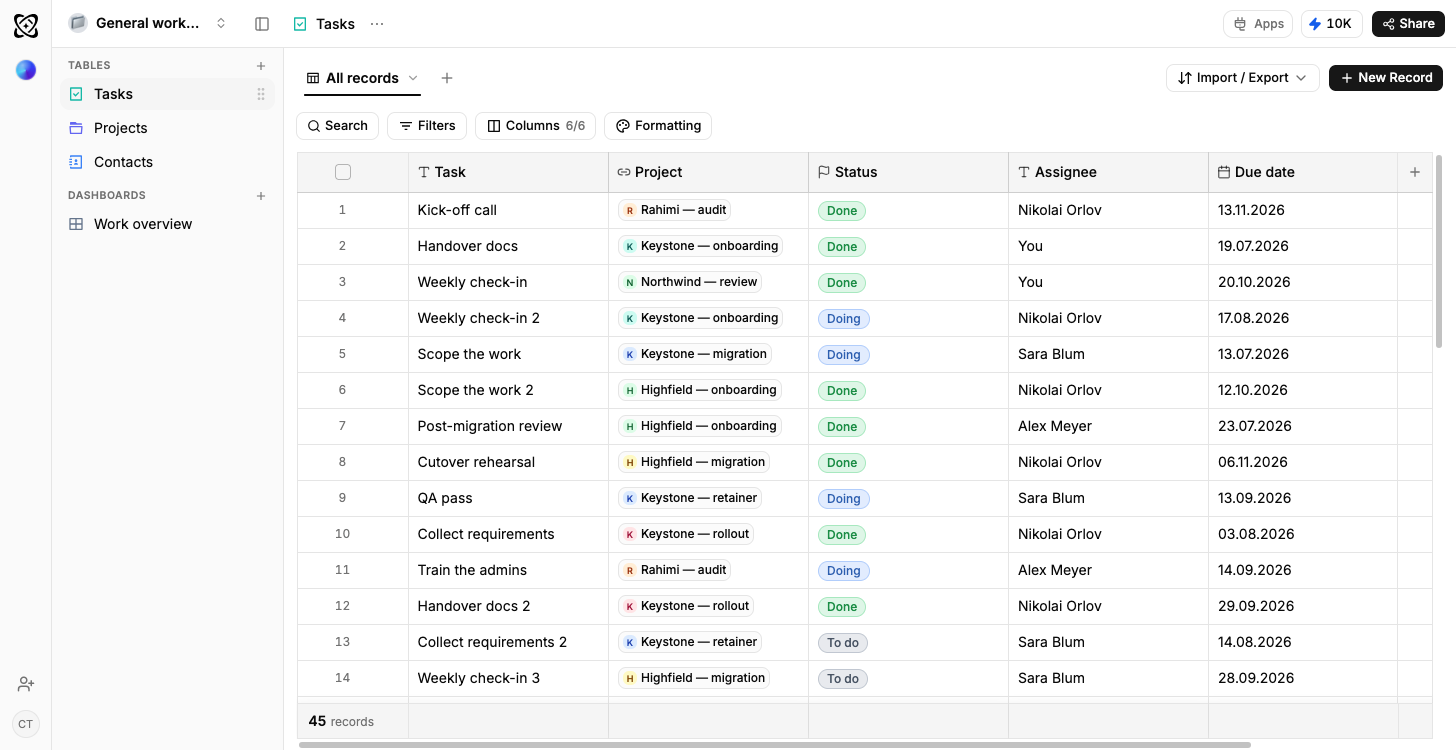
General workspace
Projects and budget by status
Frequently asked questions
Not a fixed process you adopt, the tables your pipeline actually needs, built from how you describe it.
Yes. Upload the spreadsheet or connect the Google Sheet: headers become typed columns, stage as a select, value as currency.
No. Ferra reads forwarded email and sends notifications over Slack, Telegram, WhatsApp or email. It is not a sequencer.
From the deals table, value summed across the stages and close dates you filter on. Ask in plain English; save the chart to a dashboard.