

Instagram analytics template
Posts, reach and follower growth for one account, with engagement rate broken out by post type.
- Typed columns, not text
- Dates, numbers, percentages and selects, so a chart draws straight off the rows.
- Sample rows on arrival
- Every table opens with data in it, so the dashboards draw before yours does.
- Your own data, imported
- CSV, XLSX, a connected Google Sheet, or an email you forward straight in.
- Reshaped by describing it
- Say what is different and Ferra changes the structure and the rows together.
What is an Instagram analytics template?
Four tables, two dashboards, and sample rows already sitting in the cells: that's what opens when you pick up Ferra's Instagram analytics template. It tracks one account in full: every post, every story, daily reach and follower growth, with the history kept on your side rather than the platform's. The dashboards: reach and growth over time, and engagement by post type.
Instagram shows you the last few weeks and then quietly drops the rest, which makes any question longer than a month unanswerable. This template keeps a row per post, a row per story, and a row per day, so the history accumulates on your side. Reels, carousels and single images sit in the same table with a type column, which is what turns "reels do better, I think" into a number you can put in front of somebody.
What the four tables hold
Posts holds one row per post in the grid: the caption, the date it was published, the type (Reel, Carousel, or a single image), the reach, the saves, and an engagement rate as a percentage. Stories tracks different things on purpose: one row per story with frames, views, exits, replies and a completion rate, because where people dropped out matters more there than how far a story travelled. Daily insights is the account-level layer, one row per day of reach, profile visits, website taps and new followers. Audience is a snapshot: followers, the net change, the top country and the top age band on that date.
The window Instagram will not give you back
Try answering a question that spans more than a month inside the app. You can't. Instagram's own insights show a recent window and quietly drop everything behind it, however carefully you scroll. A row per post, a row per story and a row per day fixes that by accumulating: once a daily figure is written down it stays written down. This February lines up against last February instead of against nothing, and a handover no longer takes the account's history out the door with it.
One column that settles an argument
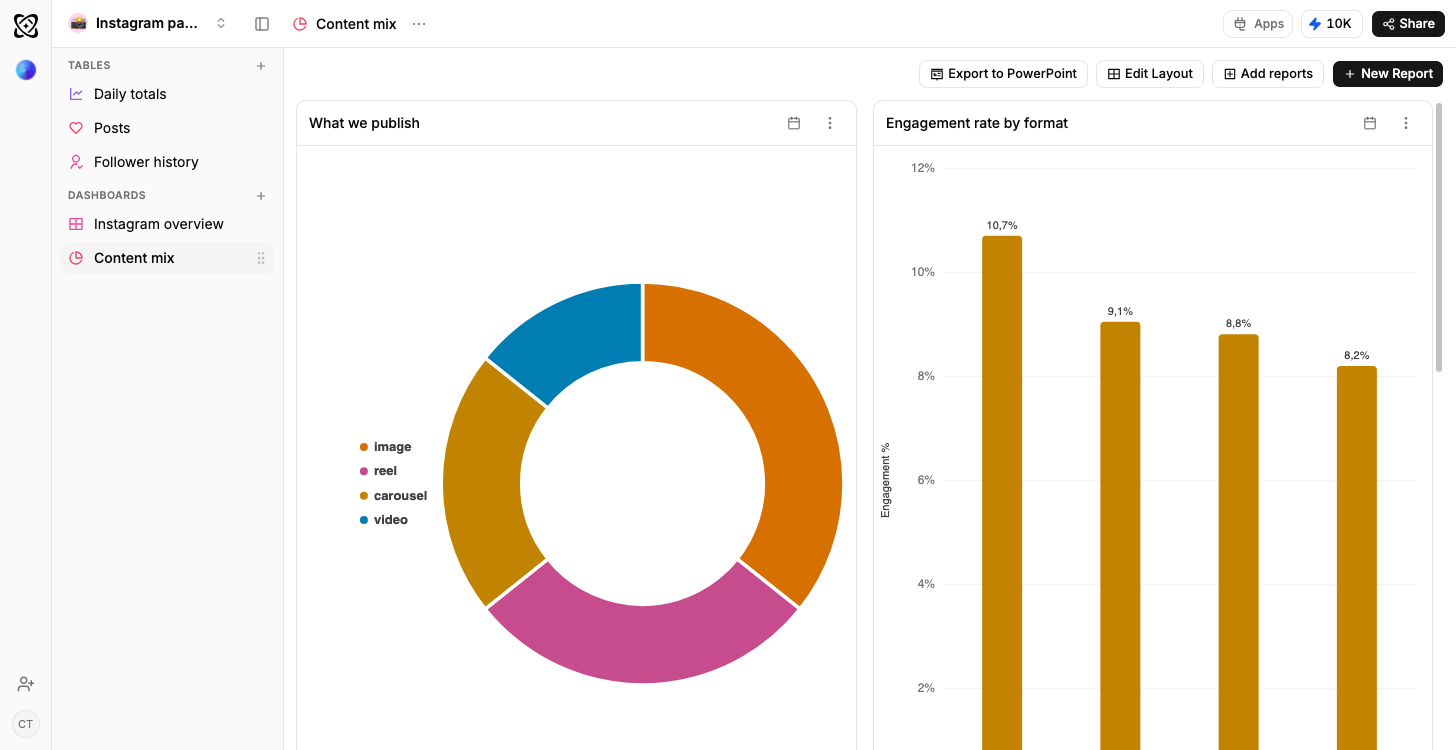
"Reels do better, I think" has ended plenty of meetings without settling anything. A single Type column settles it: reels, carousels and single images live in the same Posts table, so one ranked chart shows saves and engagement rate beside each format: a number you can put in front of a client or a founder rather than a hunch. Stories stay separate on purpose. Their telling numbers are frames, exits and completion rather than reach, and mixing the two would flatten both.
The two dashboards
A reach spike without a cause attached is trivia. Reach and growth over time plots daily reach against new followers with your posting dates marked on the same axis, so the spike and the post behind it sit on one chart instead of in somebody's memory. Engagement by post type ranks the formats and lists the strongest few posts of each underneath: that's what makes the chart something you act on, not just something that's true. Both are drawing the moment the workspace opens.
Questions you can type
Ask which post type gets the best engagement rate, reels, carousels or single images, and you get the ranking. Ask what reach looked like in the week after your biggest post, and the answer reads the daily rows around that date. "Which posts drove the most profile visits and website taps" sets the post table against the account-level numbers from the same days. And "how many followers did we net last month, and on which days" reads the audience snapshots as a series.
Adapting it
Extend it toward whatever you actually argue about. Link a Hashtags table to posts and you learn which tags travel; a column for the hook, the creator or the campaign works the same way. Describe the change in plain words and Ferra applies it to the structure and to the posts already logged, so a new column never shows up trailing two hundred blank cells.
Who it suits
One account, taken seriously: that's the profile. A creator building an audience fits. So does a small brand, or a social manager whose report covers Instagram specifically rather than everything at once. Posting to several platforms? The cross-platform social media analytics template holds all of them in one model instead.
Getting your numbers in
Nothing here streams live. You import. If your workspace has Ferra's social import enabled, Instagram comes in through it, re-runnable whenever you want fresh rows rather than running continuously. Without it, Instagram's own export or a Google Sheet you already keep is the route, read into the same tables, and that works today. A monthly refresh is enough to keep the daily and audience tables current.
You may also like
Browse all templates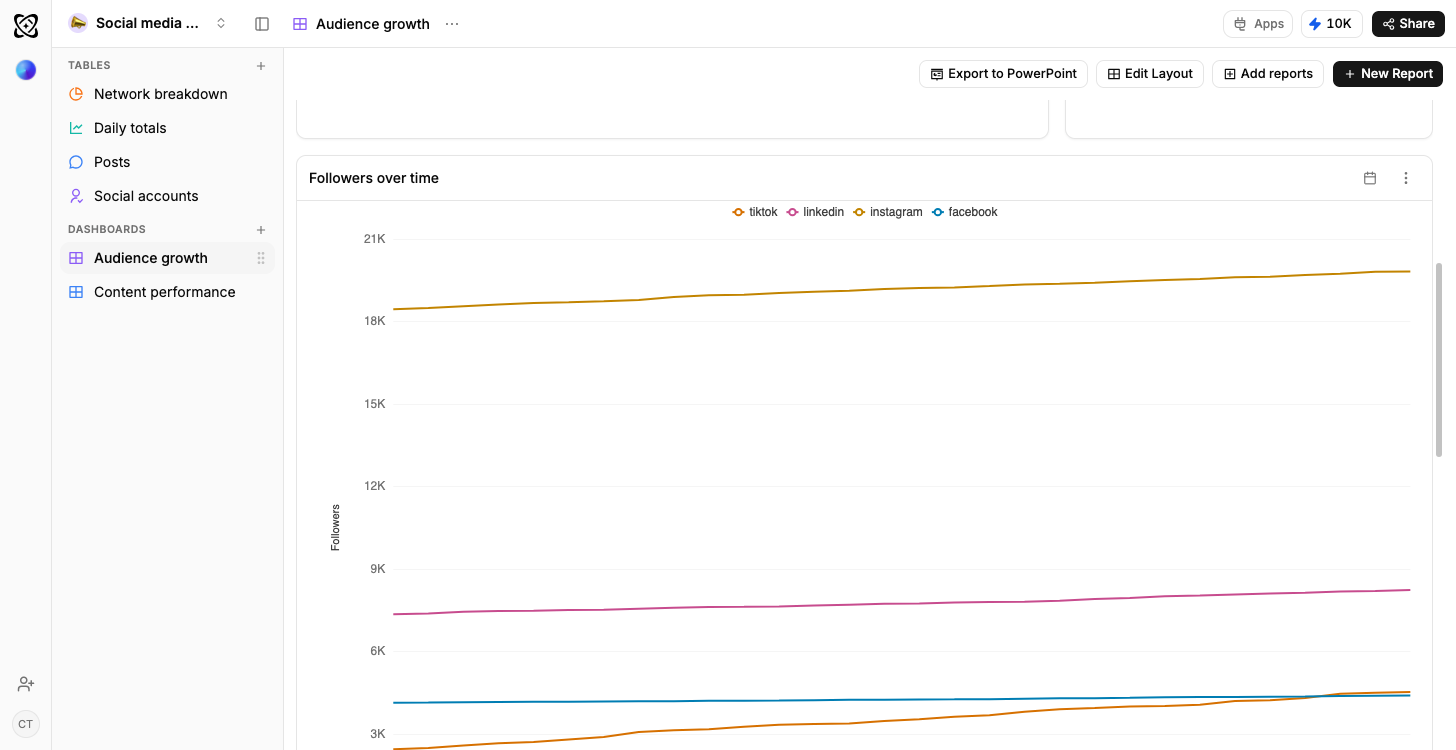
- TikTok
- YouTube
Social media analytics
Every channel compared, and what works where
Sales pipeline
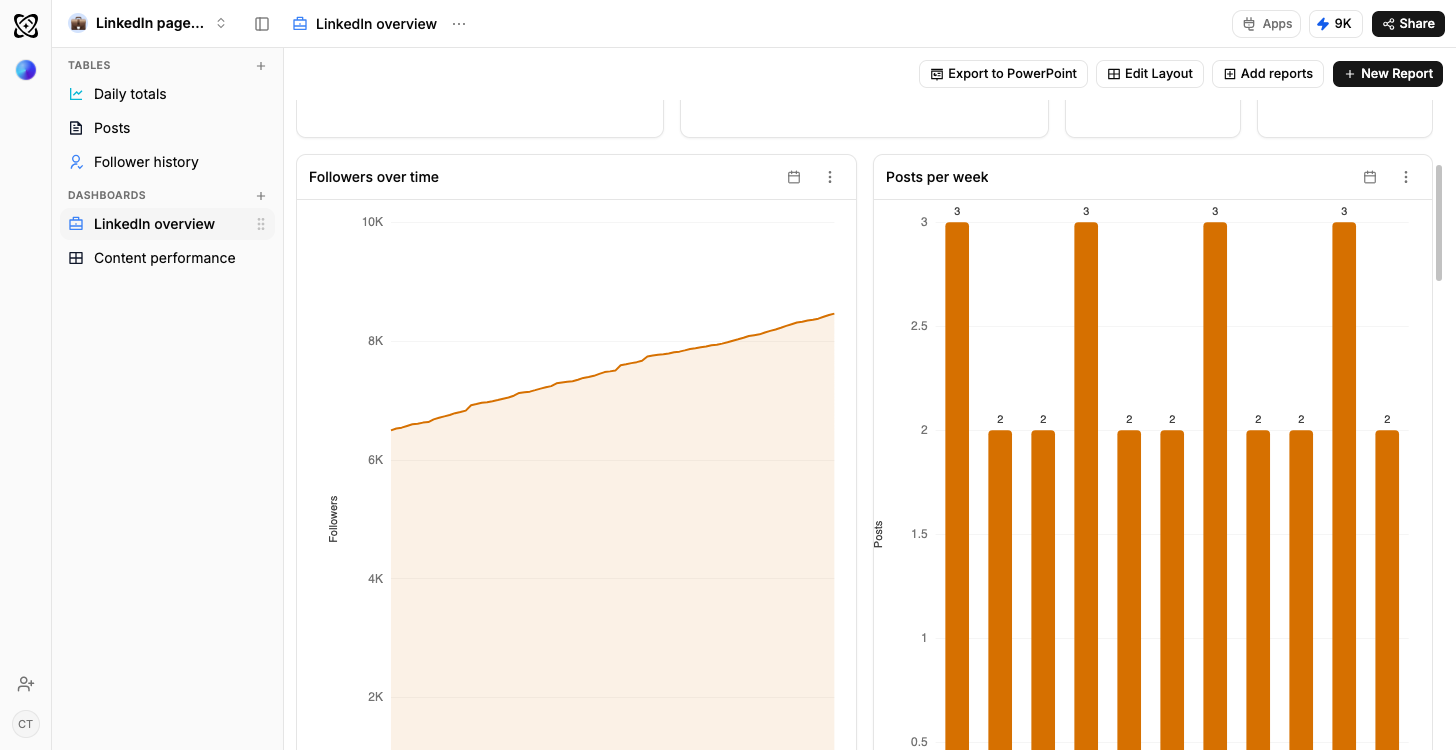
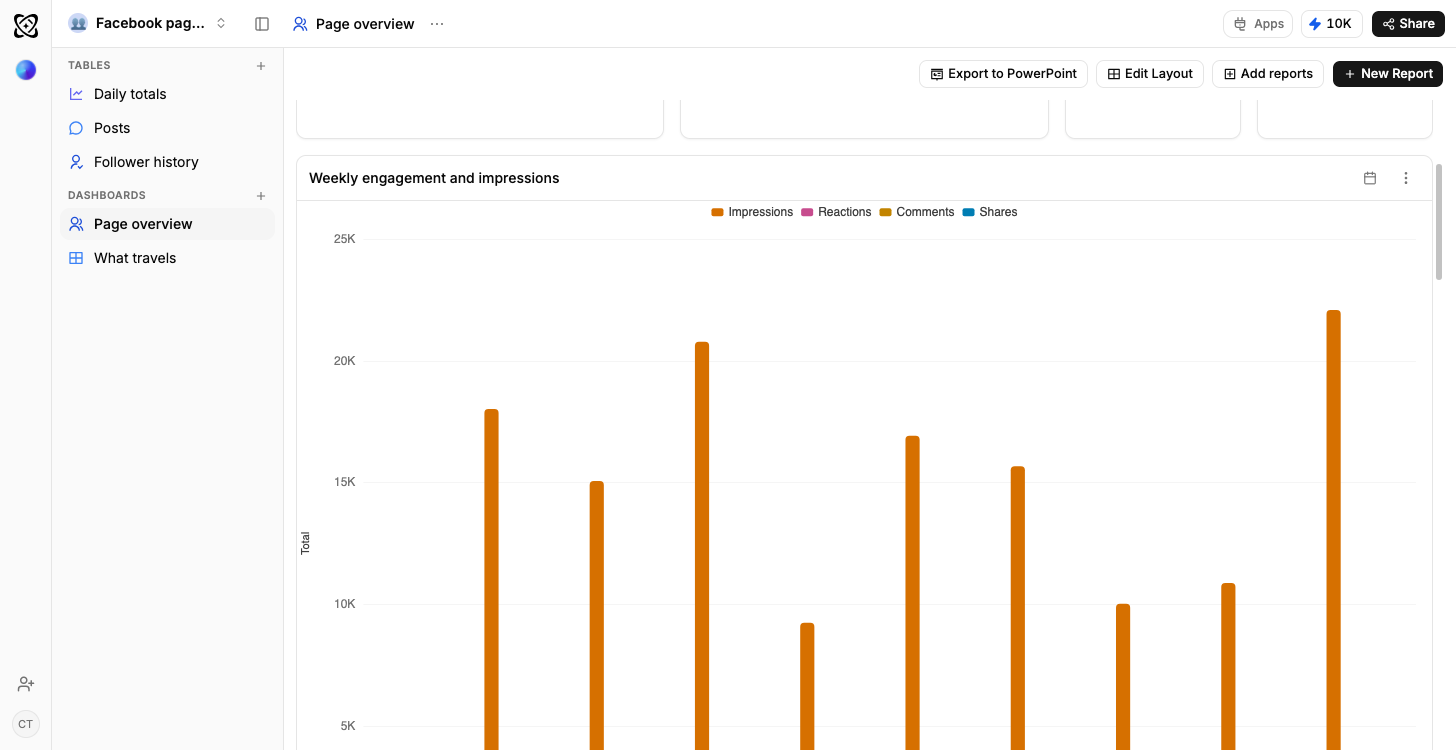
Open pipeline by stage, results by owner
Real estate
Portfolio value and leads, by stage
Recruiting
Candidates by stage, openings by status
Client work
Due this week; shipped but not billed




Frequently asked questions
The questions people ask before starting from the Instagram page analytics template.
Through Ferra’s social import, where your workspace has it enabled: re-runnable rather than a live feed. Otherwise Instagram’s own export or a connected Google Sheet reads into the same tables, and that works today.
Because the numbers that matter are different ones, frames, exits and completion rather than reach and saves. Mixing them would flatten both.
Yes. Type sits on every post row, and engagement by post type ranks the formats with saves and engagement rate beside each.
As far back as you load. Once a daily figure is in the table it stays there, so you keep the months Instagram stops showing.
Own the history Instagram drops after a few weeks.
Reels, carousels and single images sit in one table with a type column, so ranking them on engagement and saves is a chart rather than an opinion.
Use template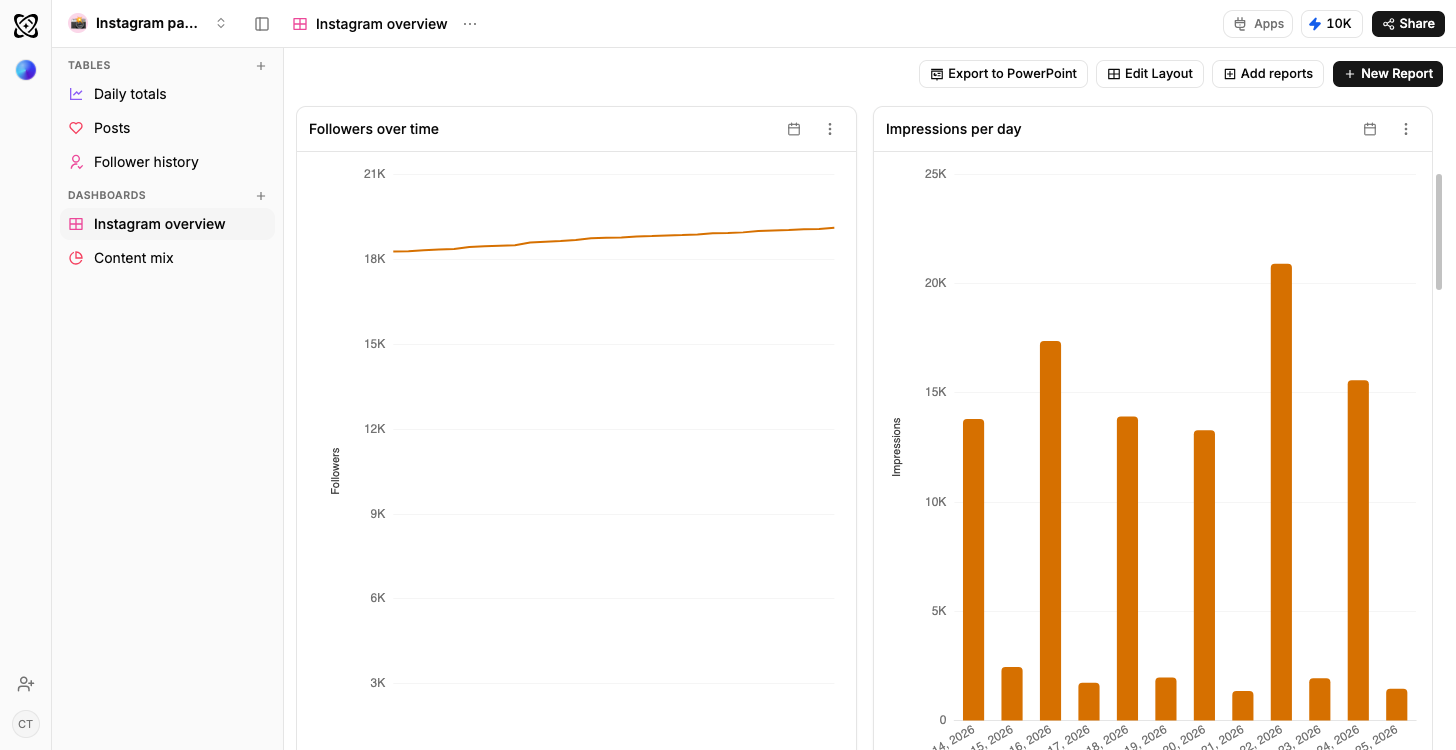
Own the history Instagram drops
A row per post, a row per story and a row per day accumulate here, so a question longer than a few weeks still has an answer.
Typed columns, explainedReels against carousels, ranked
Type sits on the post row, so engagement and saves compare side by side instead of resting on “reels do better, I think”.
How a dashboard gets builtWhere people leave a story
Frames, views, exits and a completion percentage sit on the story row, so the drop-out is a column rather than a guess.
Why a column has a type