
Logistics template
Shipments, carriers and routes, with transit times and late deliveries broken down by carrier and lane.
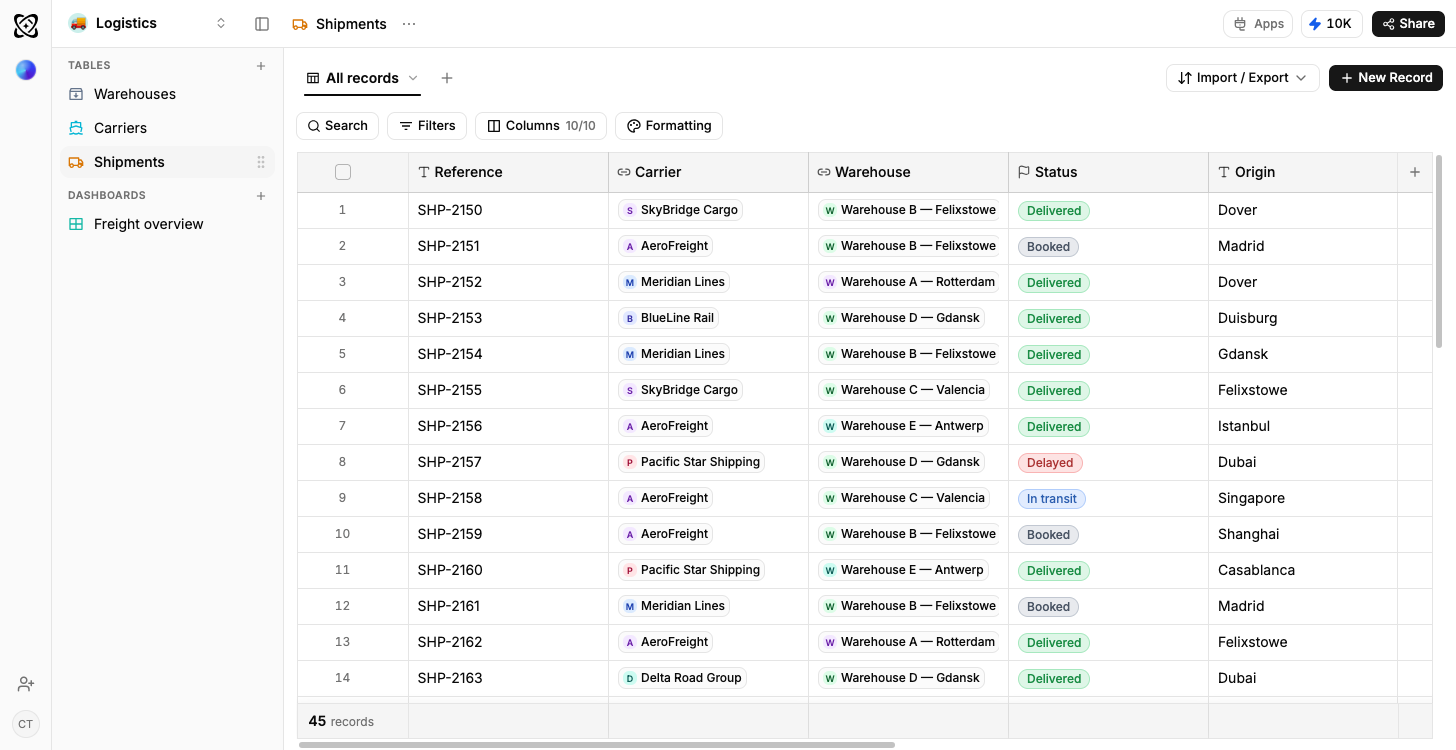
- Linked tables, not tabs
- Relationship columns join the rows instead of copying them into three places.
- Sample rows on arrival
- Every table opens with data in it, so the dashboards draw before yours does.
- Your own data, imported
- CSV, XLSX, a connected Google Sheet, or an email you forward straight in.
- Reshaped by describing it
- Say what is different and Ferra changes the structure and the rows together.
What is a shipment tracking template?
Freight splits three ways: the consignments moving, the carriers moving them, and the lanes they move on, and Ferra's shipment tracking template links all three. Transit days is a formula, never a typed number, so it can't quietly rot. The workspace opens on two dashboards: on-time performance by carrier, and transit time against target by lane.
A carrier is only late relative to something, which is why this template gives routes a target transit time and shipments a derived actual. Once a shipment points at both a lane and a carrier, the two questions that matter separate cleanly: is this route slow, or is this carrier slow on it? The sample rows cover a few exceptions so the on-time chart is not a flat wall of green on the day you open it.
Shipments, carriers, routes
One consignment, one row: each shipment points at both a route and a carrier and carries a reference, a status, a dispatch date and a Transit days column no human ever types. SH-4412, Rotterdam to Milan, Delmar Freight, In transit, dispatched 16 Feb. Carriers holds one row per haulier you contract: the mode they run, the rate they charge, the contact for dispatch, the date the contract runs to, and an On-time rate formula counting across every shipment attached to them. Routes is the lane list: the lane itself, its distance, its mode, a target transit time, an expected cost per shipment, and a running count of the shipments that have used it.
Late compared to what?
Late means nothing on its own. A carrier is only late relative to a number written down somewhere, and here that somewhere is the Routes table, where every lane carries a target transit time and an expected cost. The moment a shipment points at both a lane and a carrier, the two questions people conflate come apart cleanly: is this route slow, or is this carrier slow on this route? Skip the lane as its own row and every delay reads as a carrier problem, and you end up renegotiating the wrong contract.
The two dashboards
On-time by carrier plots delivered against target with the average overrun in days beside it, so the carrier running an hour late and the one running two days late stop being the same red bar. Transit time by lane draws actual against target over time. That second chart is where a route that's been getting slower since November finally shows itself: the drift nobody catches shipment by shipment, because each one is only a little late. The sample shipments include a few exceptions on purpose; neither chart opens as a wall of green.
Questions worth asking of the rows
“Which lanes are running longer than their target transit time” checks the formula on the shipment against the number on the route. “Which carrier has the worst on-time record this quarter” reads the rollup already sitting on the carrier row. “What's in transit right now, and when should it land”: the status column answers that one on sight. And “what does an average shipment cost us on the Rotterdam lane” comes off the route row plus every shipment attached to it.
Giving a delay a reason
A late flag says a shipment missed its window; the monthly carrier review turns on why it missed. Link an Exceptions table to Shipments and every delay starts carrying a cause: customs, say, or a missed collection, or a pallet that arrived damaged, and the review becomes a conversation with evidence in it. Fuel surcharges come in the same way. So does a second leg per shipment, or a customer per consignment.
Who it suits
A freight forwarder. A shipper managing its own outbound. A distributor with a handful of hauliers on contract, or an operations lead who's been asked to prove which carrier is actually the problem. What it isn't: a transport management system: no rating, no booking, no live tracking feeds. It's where the performance record lives, and it's honest about that.
Getting your shipment history in
Routes and carriers go in first so shipments have something to point at; the consignments follow. CSV and XLSX import directly, and a Google Sheet someone already keeps updating can stay connected instead of being re-uploaded each month. Bring a few months of history if you have it: the lane chart earns its place on drift, and drift only shows over a season.
You may also like
Browse all templates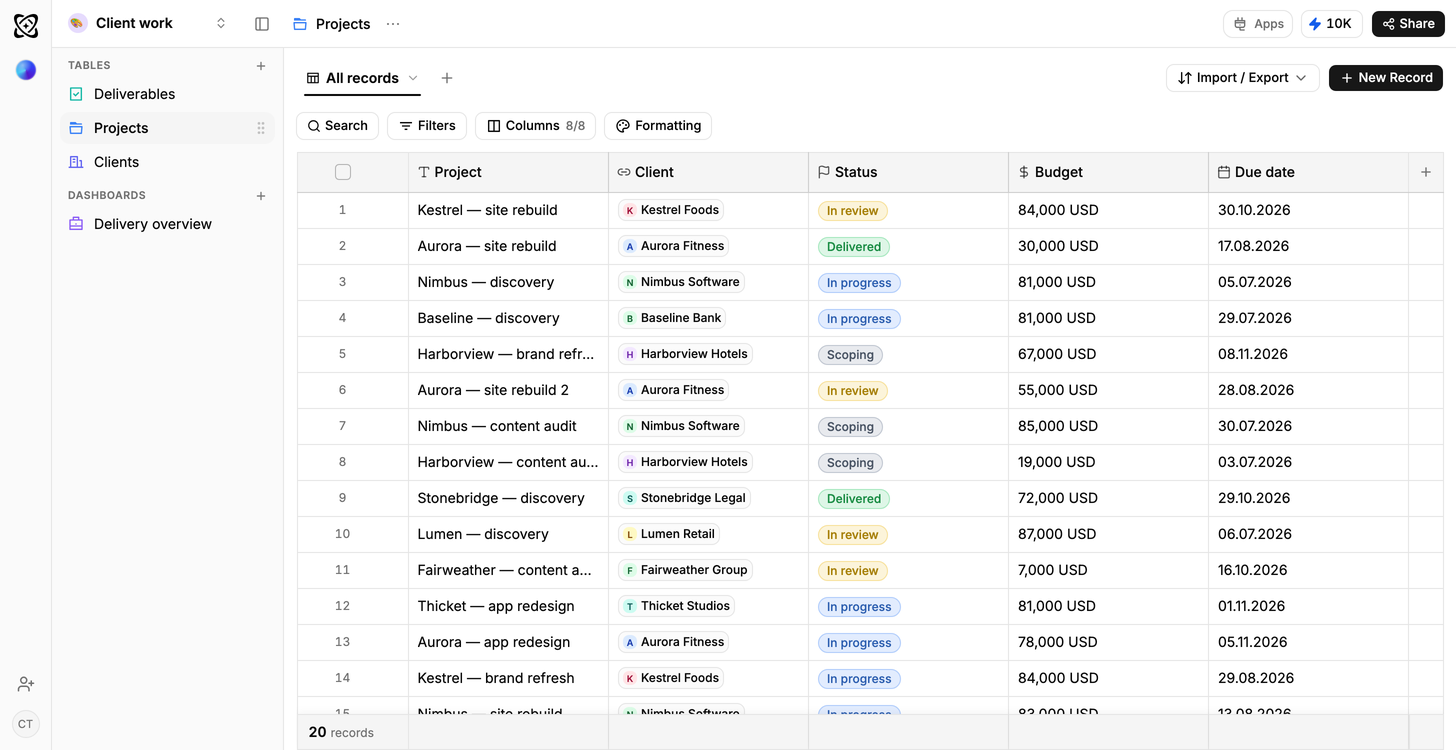
Client work
Due this week; shipped but not billed
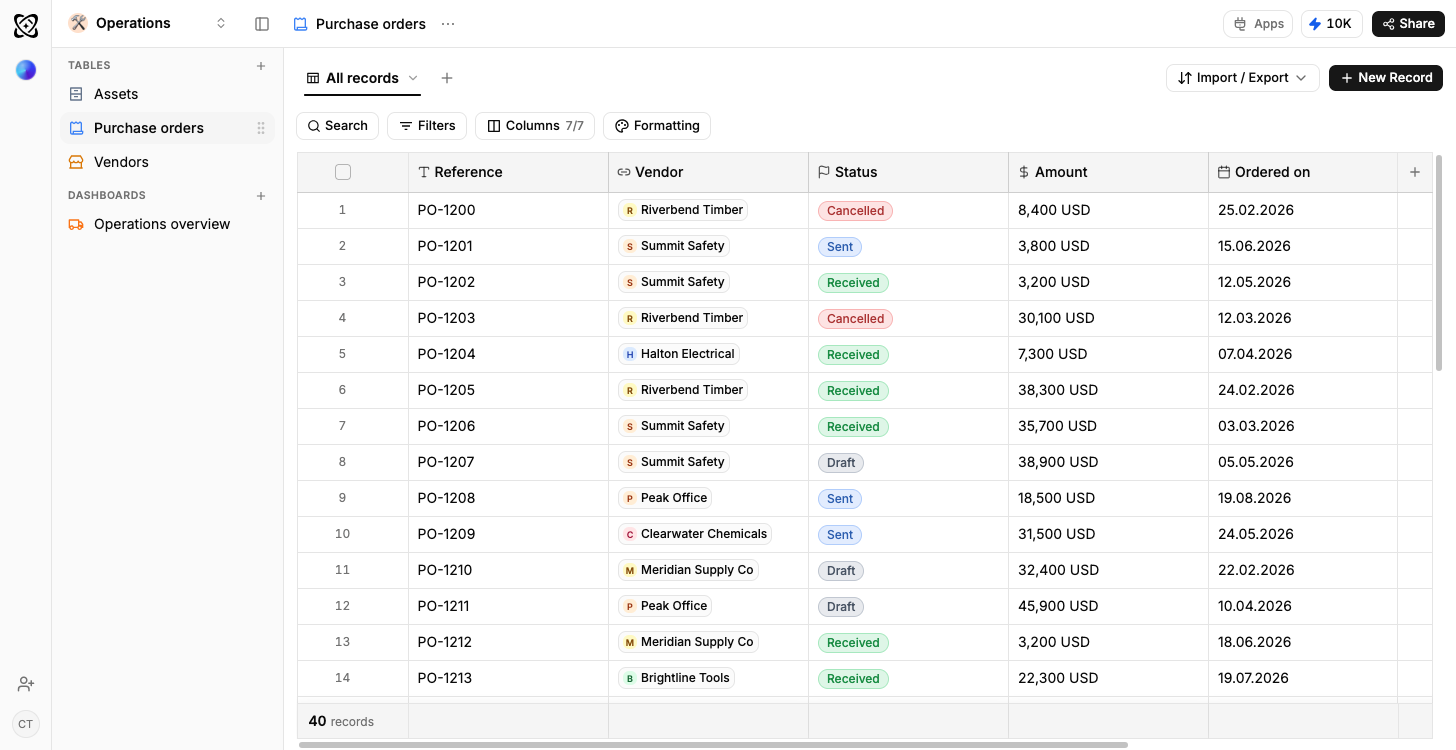
Operations
Orders in flight, spend by supplier
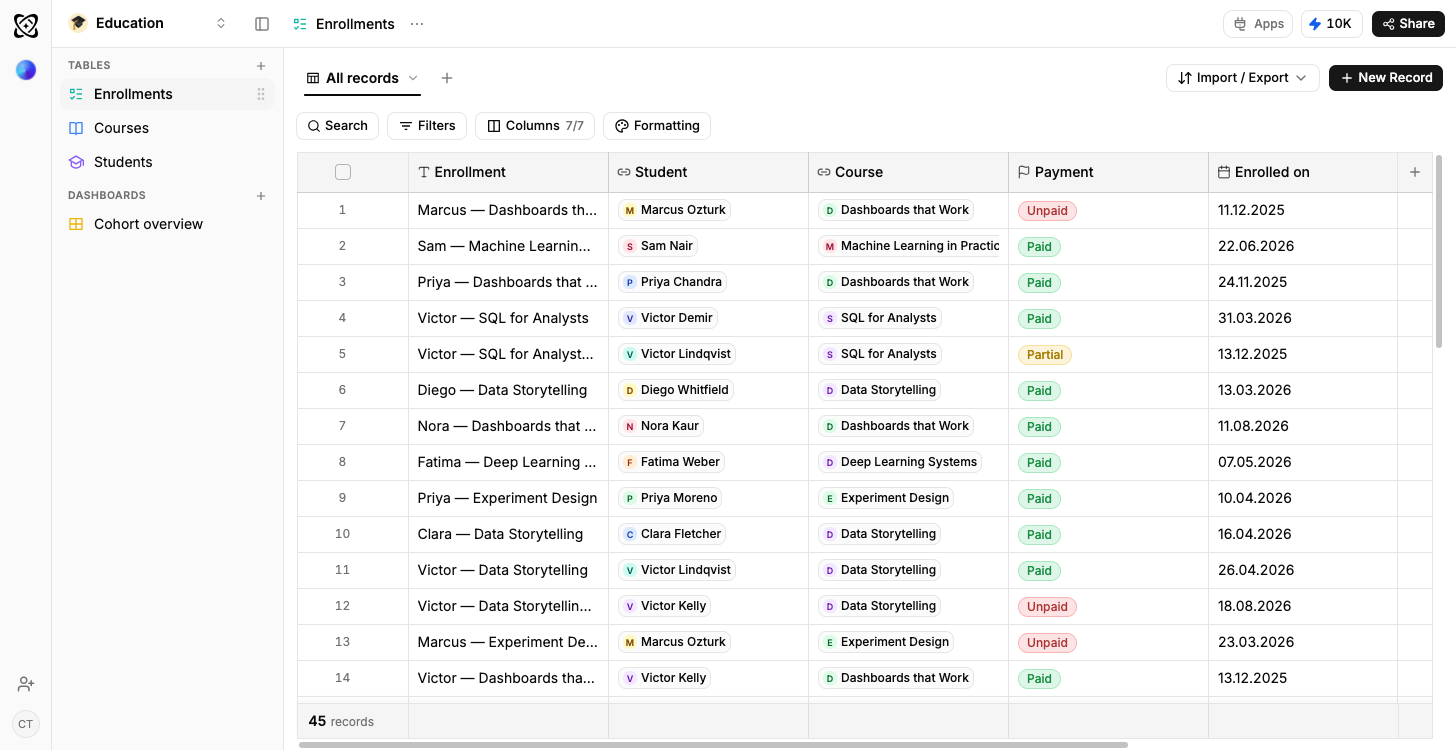
Education
Attendance and completion by cohort
General workspace
Projects and budget by status
Sales pipeline
Open pipeline by stage, results by owner
Real estate
Portfolio value and leads, by stage
Recruiting
Candidates by stage, openings by status
Research
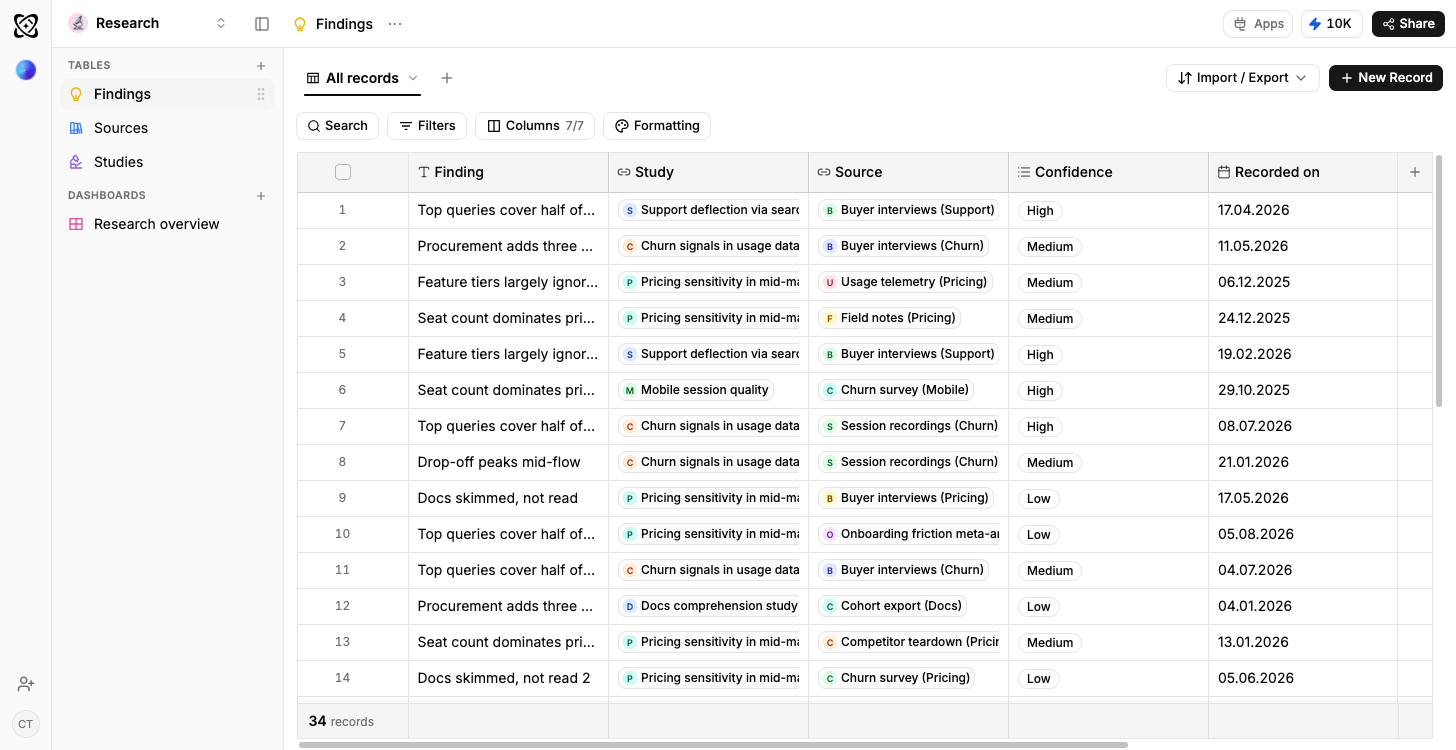
Findings per theme, by confidence and source
Frequently asked questions
The questions people ask before starting from the Logistics template.
It is a formula column on the shipment row rather than a number anybody types, and each lane carries its own target transit time to compare it against.
Yes. Add an Exceptions table linked to Shipments and a delay carries a cause instead of just a flag.
That is the point of keeping Routes as its own table. On-time by carrier and transit time by lane separate the two questions instead of blaming whichever is easier to see.
Yes, on the free plan with no credit card, and the sample shipments include a few late ones so the charts mean something on day one.
Tell a slow lane from a slow carrier.
Target transit sits on the route and actual transit on the shipment, so an overrun is a number in days rather than an argument.
Use template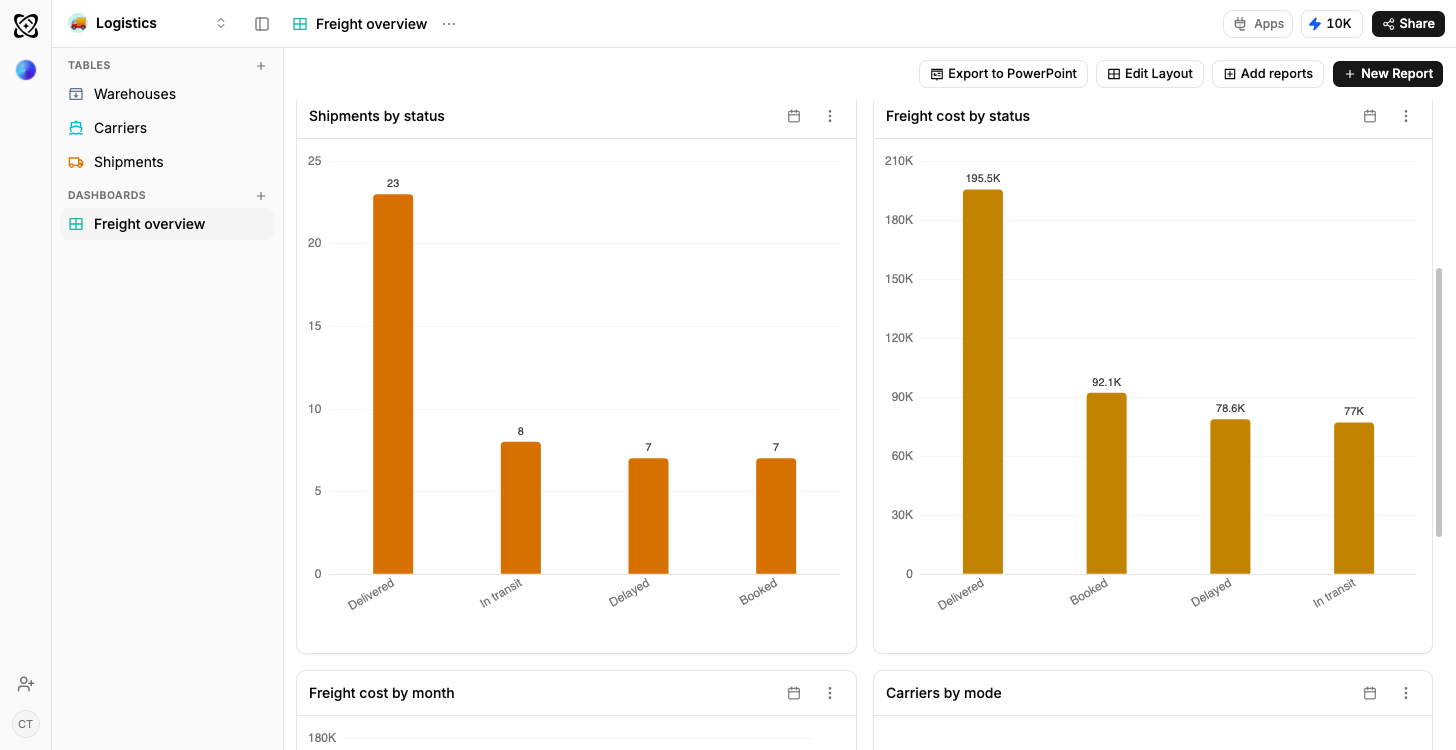
Delay measured, not asserted
Transit days is derived from the dispatch and arrival dates on the shipment, so “late” is a number somebody can act on.
How a derived column stays filledWhich carrier, and by how much
On-time by carrier plots delivered-against-target with the average overrun, so an hour late and two days late stop being the same red bar.
How a dashboard gets builtThe people who never open a dashboard
Drivers and suppliers get a WhatsApp or Telegram message carrying the one number that concerns them, sent from the workspace.
Where reports go