
Real estate template
Properties, leads and viewings, linked, plus a weekly overview of active listings, lead source and viewing outcomes.
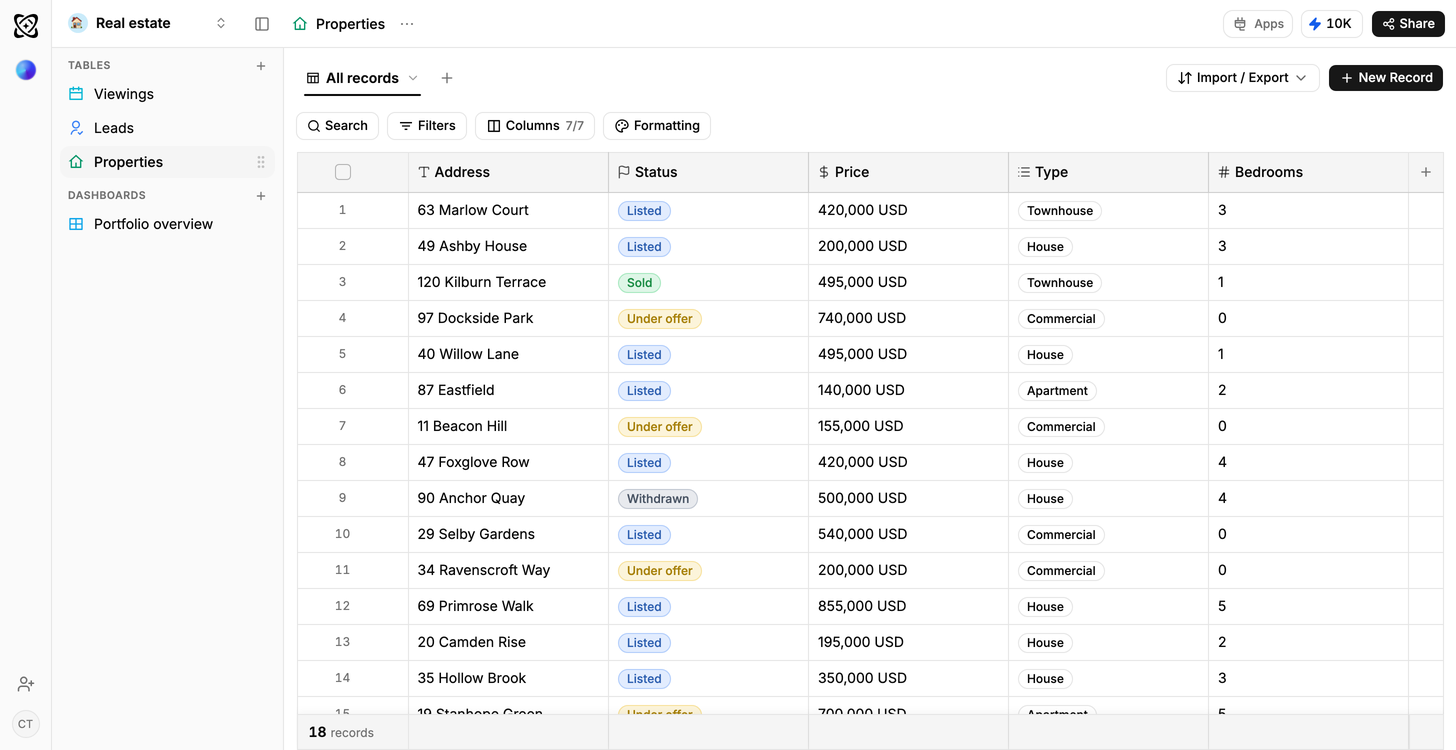
- Linked tables, not tabs
- Relationship columns join the rows instead of copying them into three places.
- Sample rows on arrival
- Every table opens with data in it, so the dashboards draw before yours does.
- Your own data, imported
- CSV, XLSX, a connected Google Sheet, or an email you forward straight in.
- Reshaped by describing it
- Say what is different and Ferra changes the structure and the rows together.
What is a real estate CRM template?
What's on the books. Who's looking. Who viewed what on Saturday. Three questions, usually three different systems. This template keeps them as one workspace. Ferra's version links Properties, Leads and Viewings, ships with sample rows in place, and opens on two dashboards, so a listing can tell you how many people have walked through it and a lead can tell you what they've already turned down.
An agency runs on three things that keep drifting apart: what is on the books, who is looking, and who saw what on Saturday. This template keeps them as one workspace: a viewing points at both the property and the lead, so a listing can tell you how many people have walked through it and a lead can tell you what they have already turned down. The weekly overview is the part most agencies rebuild by hand every Monday.
What each of the three tables holds
18 Marlow Court, Flat, $465,000, three bedrooms, Under offer, listed 4 Jan: that's one row in Properties, and it carries a listing from instruction to completion: the address, the type, an asking price, the number of bedrooms, a status and the date it was listed. Leads records who's looking and what they're actually after, not just a name: source, budget, the stage they've reached, the agent on them, and a plain-English note such as two-bed, near a station. Viewings is one appointment per row, and it's the table doing the real work: it points at both a property and a lead, and it carries the date and time, whether they attended, the outcome and the feedback they gave.
The double link a spreadsheet cannot hold
A viewing belongs to two things at once, and that's exactly the fact a grid of rows and columns has nowhere to put. Give it its own row, with a relationship column to each side, and two questions that used to need a phone call answer themselves: this flat has had six viewings and still no offer, and this buyer has now seen four things above their stated budget. Feedback lands on the same row as the appointment. Monday morning with the vendor gets evidence: loved it, worried about parking: rather than an impression somebody half-remembers.
The Monday report, already built
An eleven-week listing shouldn't be news the vendor breaks to you. Listings and their movement shows active, under offer and sold with days on market by property type, so the slow ones surface before that call. Where the offers come from sets lead source against viewings booked and offers made: the only honest way to separate a portal that produces enquiries from one that produces buyers. Most agencies rebuild exactly this report by hand every week. Here it's drawing on the sample rows the moment the workspace opens.
Asking it questions in plain English
Type the question; skip building the view. Which listings have had more than five viewings and still no offer pulls Viewings and Properties together. Which lead source turns into offers most often joins Leads to the outcome on each appointment. What's booked in for this weekend, and which agent is showing it, is a date filter that ends in a name. And how long a property sits on the market, by type, is the number vendors ask for and nobody has to hand.
Making it fit sales and lettings
Lettings is the change agencies make first: add a Landlords table, link each property to one, and the rental side lives in the same workspace and on the same dashboards instead of in a second spreadsheet. A fees column, a chain status, a second agent per viewing: describe it, and Ferra changes the structure and the rows already in it together, so an existing listing doesn't end up with an empty column beside it.
Who it suits
An independent agency. A small branch network. Anywhere the book runs to tens or low hundreds of listings and currently lives on a shared sheet plus a diary. If a full agency system with portal feeds, contracts and compliance already runs your branch, this isn't a replacement for it: it's the home for the lead and viewing reporting that system makes hard to get out.
Getting your current book in
The book comes across in one sitting. A CSV or XLSX of listings goes straight into Properties, a lead export goes into Leads, and a Google Sheet somebody maintains can stay connected so it keeps feeding the same table. Bring those two across first. Then describe how a viewing joins them, and the relationship columns are set for you rather than pasted in as matching reference numbers.
You may also like
Browse all templates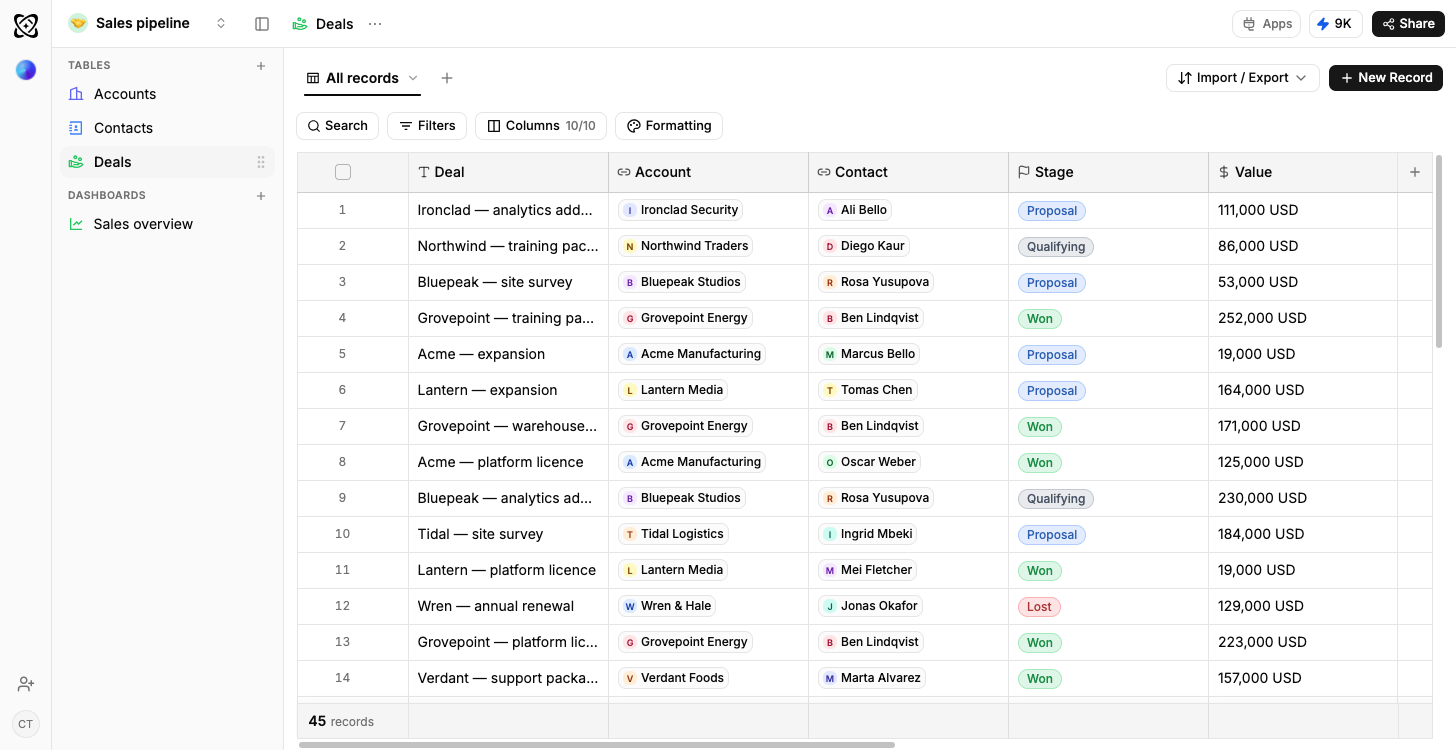
Sales pipeline
Open pipeline by stage, results by owner
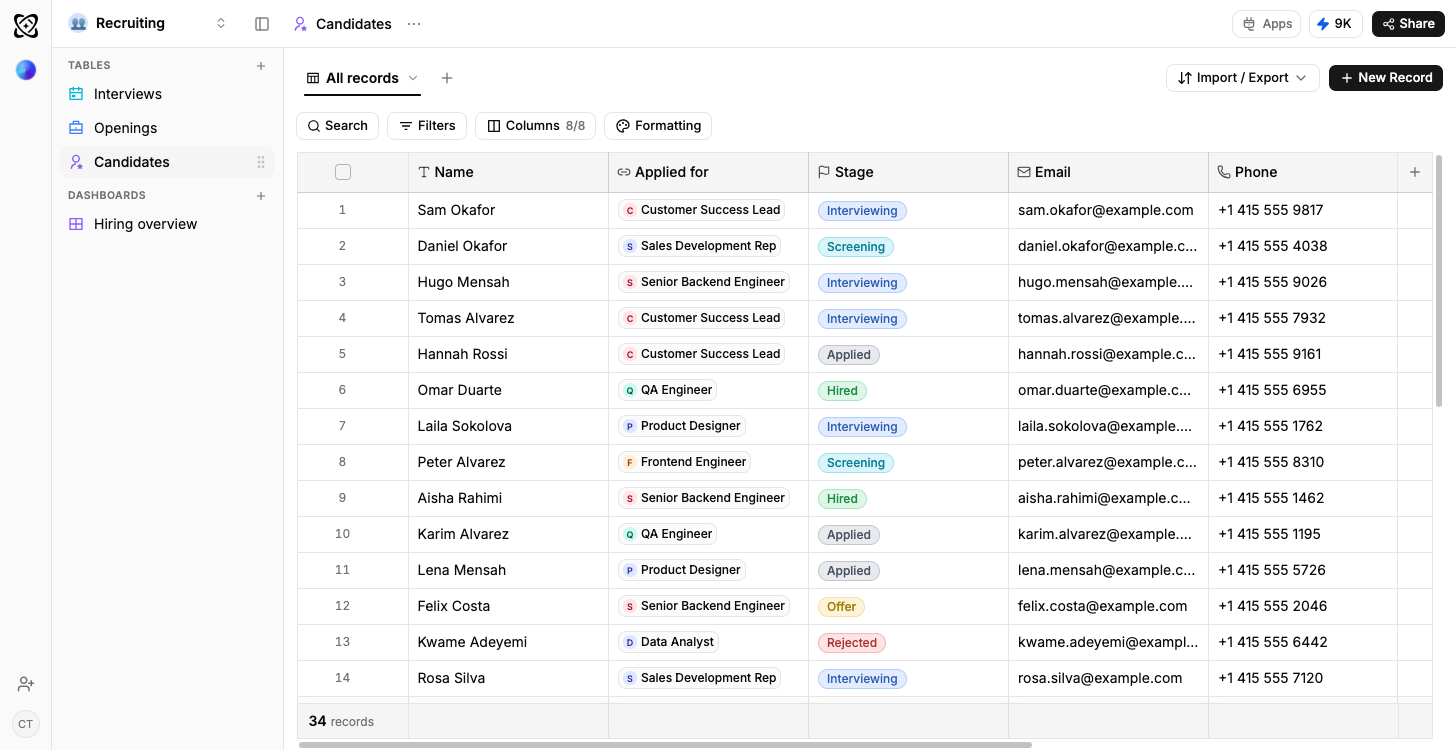
Recruiting
Candidates by stage, openings by status
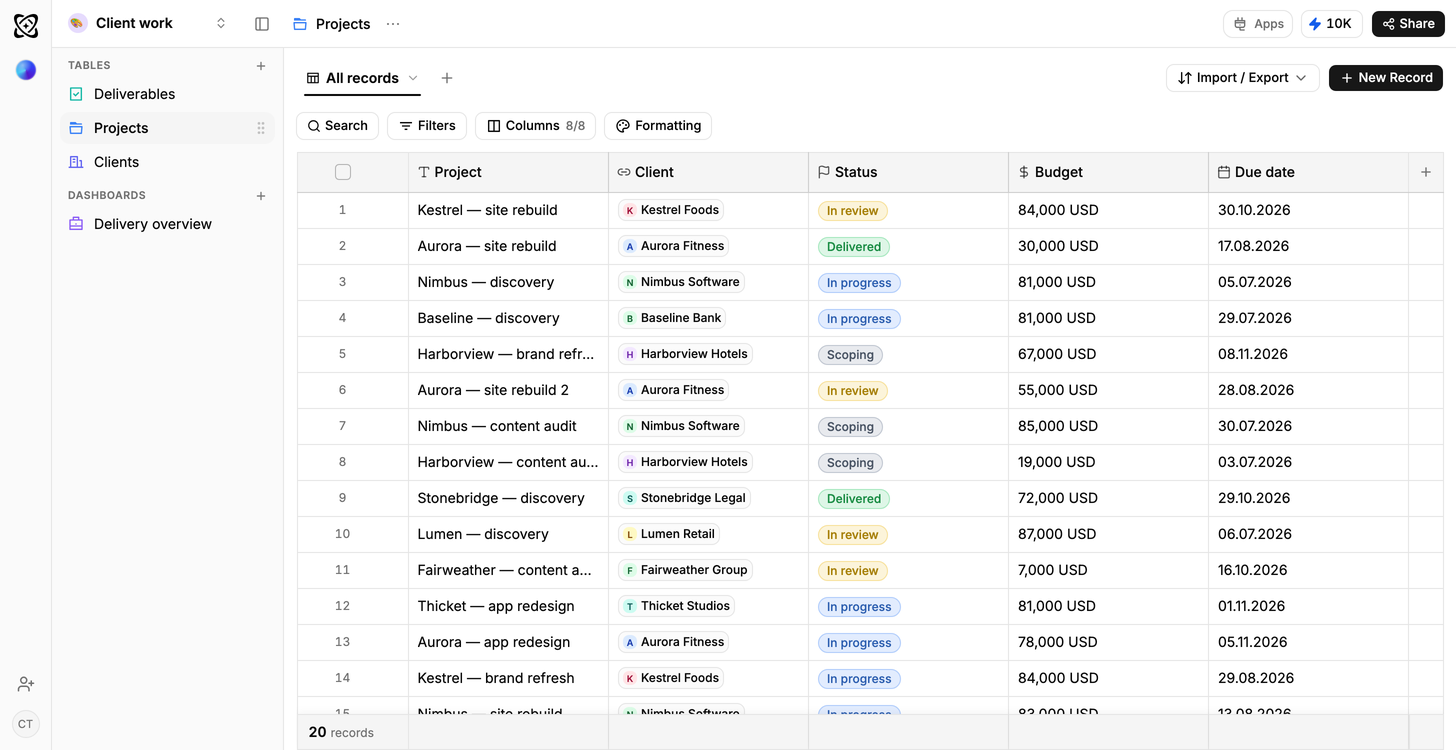
Client work
Due this week; shipped but not billed
Operations
Orders in flight, spend by supplier
Education
Attendance and completion by cohort
Logistics
On-time rate by carrier and lane
General workspace
Projects and budget by status
Research
Findings per theme, by confidence and source
Frequently asked questions
The questions people ask before starting from the Real estate template.
It covers listings, leads, viewings and the reporting over them, free to start. It does not do portal feeds, contracts or compliance, so treat it as the pipeline and reporting layer rather than a replacement for an agency platform.
Yes. Add a Landlords table and link each property to one, and the rental side of the book lives in the same workspace and on the same dashboards.
Viewings is its own table, and each row carries a relationship column to Properties and another to Leads. That is what lets a listing count its viewings and a lead list what it has already seen.
From the listed date already on the property row, read against its current status. Nothing is typed by hand, so the number is right every time the dashboard draws.
A listing that knows how many people have walked through it.
A viewing points at both the property and the lead, so the Monday overview most agencies rebuild by hand is already drawn.
Use template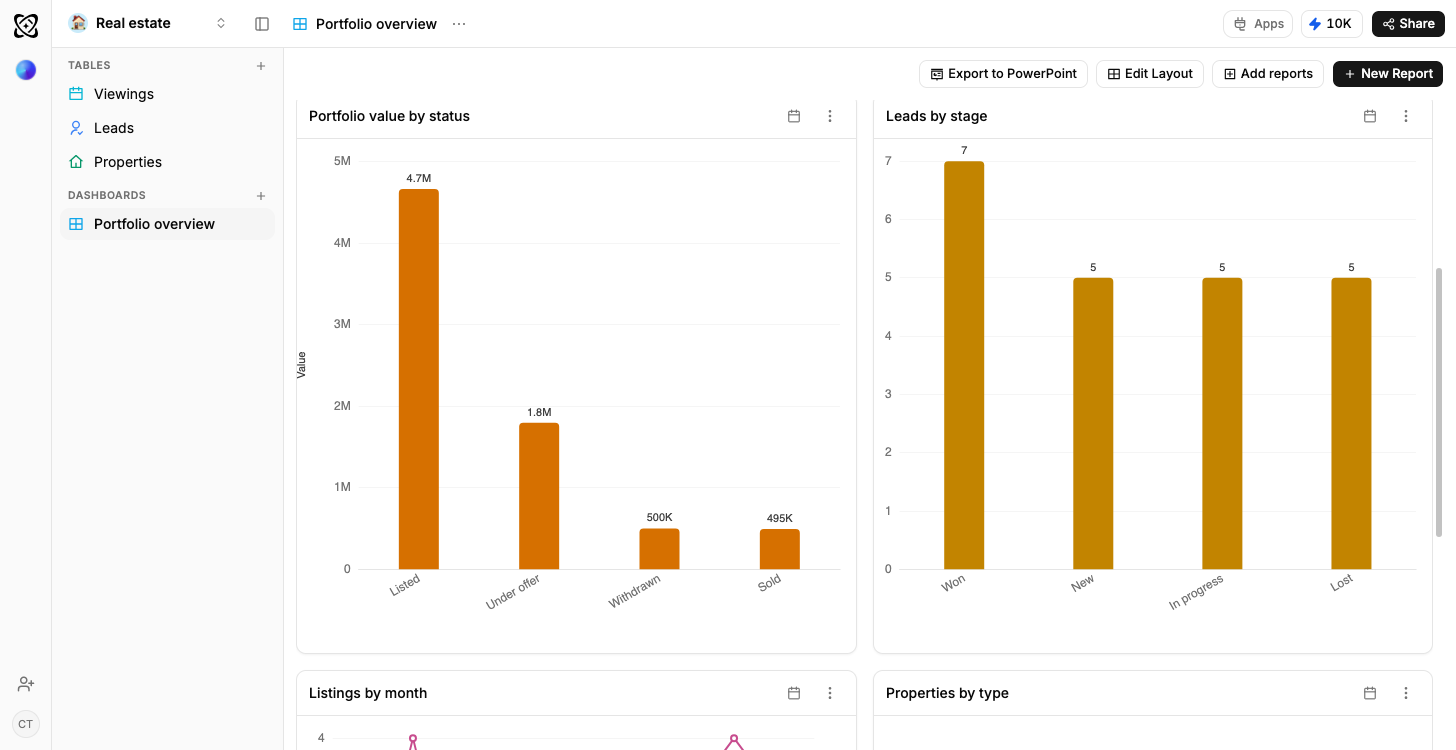
A viewing points at both sides
One appointment row links the property and the lead, so a listing can count who walked through it and a lead can show what they turned down.
How relationship columns workEnquiries against actual offers
Leads by source is plotted with viewings booked and offers made, which is the only honest way to rank a portal.
How a dashboard gets builtSaturday's list, where agents read it
A digest goes out to WhatsApp, Telegram or Slack, so whoever is showing at 14:30 does not have to open the workspace to know.
Where reports go