
- TikTok
- YouTube





Social media analytics template
Every channel in one place: posts, reach and engagement side by side, with a cross-platform performance dashboard.
- Linked tables, not tabs
- Relationship columns join the rows instead of copying them into three places.
- Sample rows on arrival
- Every table opens with data in it, so the dashboards draw before yours does.
- Your own data, imported
- CSV, XLSX, a connected Google Sheet, or an email you forward straight in.
- Reshaped by describing it
- Say what is different and Ferra changes the structure and the rows together.
What is a social media analytics template?
One tab per platform is how the monthly report became a copy-paste job. Ferra's social media analytics template holds every channel in one model instead: four tables, Channels, Posts, Daily performance and Audience growth, with every post and every daily figure linked back to the channel it belongs to, sample rows in place, and two cross-platform dashboards already drawing.
Every platform gives you its own numbers in its own shape, which is why the monthly report is a copy-paste job. This template puts all of them in one model: a channel row per account, a post row per thing you published, and a daily row per channel so trends survive after the platform stops showing them. Once reach and engagement sit in the same table with a platform column, comparing them is a chart rather than a spreadsheet somebody rebuilds every month.
What the four tables hold
Channels: one row per account per platform, carrying the platform, the handle, the follower count, the owner on your team, and a formula counting the posts attached to it. Posts covers everything you published anywhere: linked to its channel, with the caption, the date, the format (Carousel, Reel, Document), the reach it got, and an engagement rate as a percentage. Daily performance adds a row per channel per day: impressions, engagements, clicks, profile visits. Audience growth stamps a follower count onto a date with the net change and whether it came organically, so growth is a line, not a screenshot somebody took in March.
Why one model beats one tab per platform
The copy-paste report exists because each platform hands you its own numbers, in its own shape, over its own window, and none of them will ever compare itself to another. A Platform column on the channel row, plus every post and every daily figure pointing at a channel, fixes both halves at once. Reach and engagement land in the same table, so comparing Instagram with LinkedIn is a chart, not a spreadsheet rebuilt from screenshots each month. And a sixth channel? A row, not a new tab.
History the platforms will not keep for you
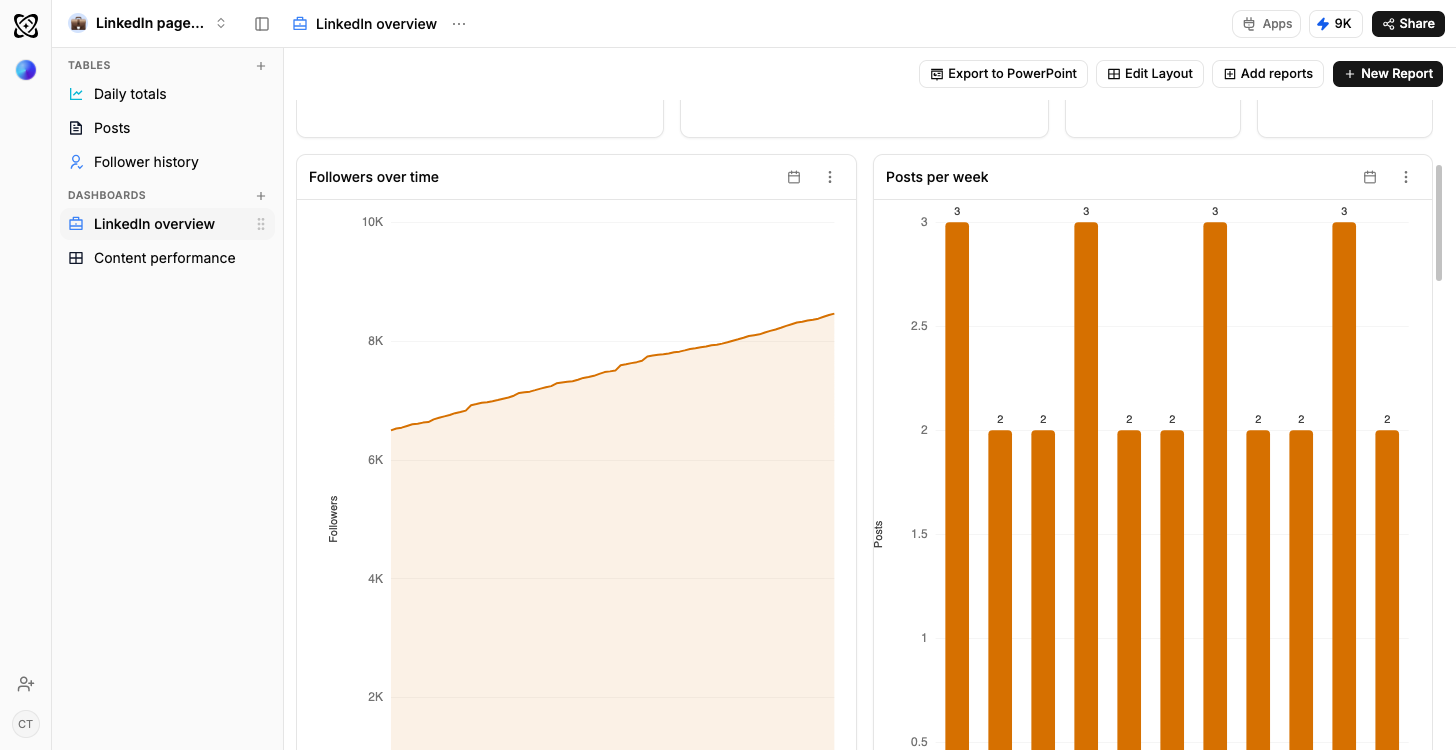
Instagram shows you a few weeks of history. LinkedIn shows a year. TikTok shows something else again, and none of them asked you first. Daily performance and Audience growth exist to outlive that retention: a row per channel per day, accumulating on your side, is what makes any question longer than the platform's window answerable at all: this February against last February, or what the account did in the quarter before the person who ran it left.
The two dashboards
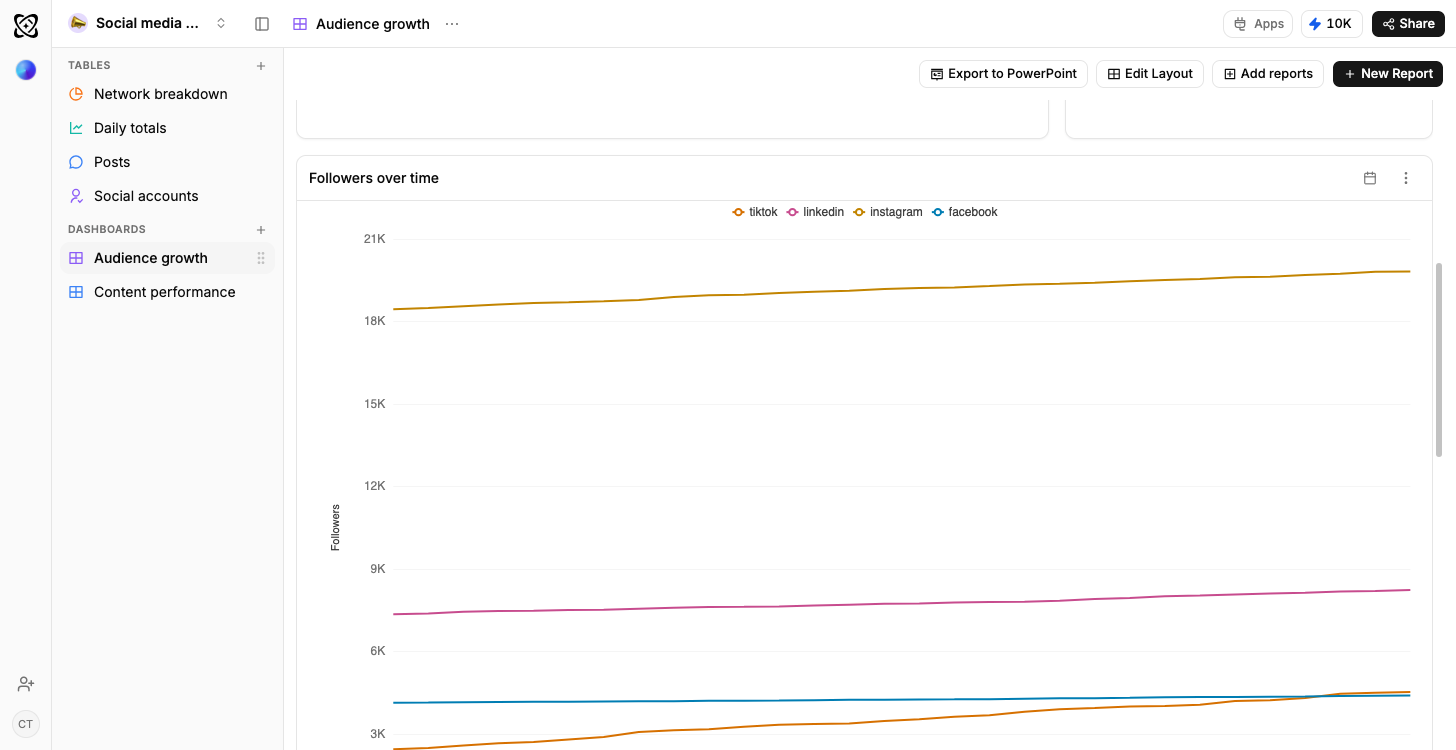
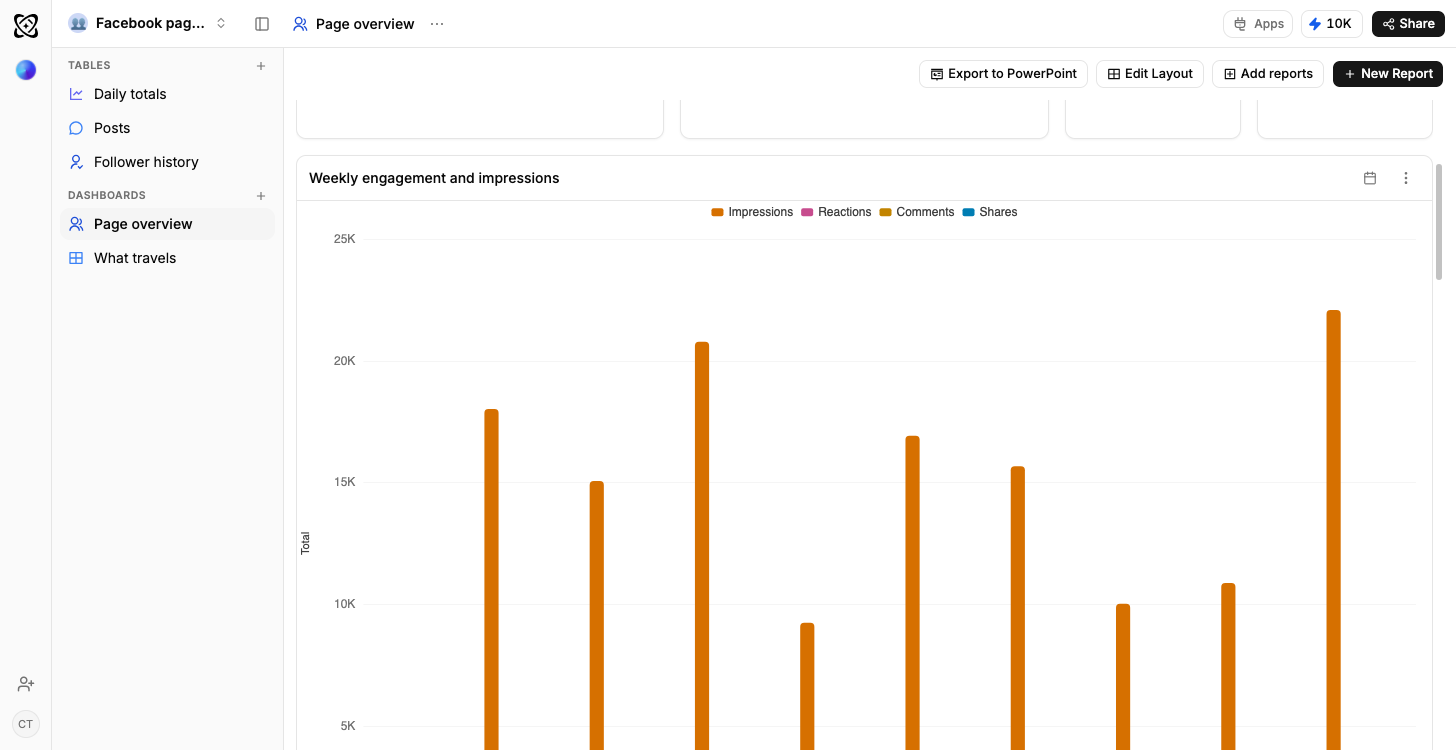
Cross-platform performance puts reach, engagement and follower growth for every channel on one set of axes over the same date range: the comparison no single platform will ever show you. What works where breaks engagement rate down by format and by platform, so the carousel that carries Instagram and dies on LinkedIn is no longer something the team argues about from memory. Both draw on the sample rows the workspace opens with.
Questions you can ask in a sentence
“Which platform gave us the most reach per post last month”, no platform can answer that individually. “Which posts performed above our average engagement rate” reads the Posts table against its own mean. “How did follower growth compare across channels this quarter” uses the dated rows in Audience growth. The best of them is “which format works on LinkedIn but not on Instagram,” because it changes next month's plan instead of describing last month's.
Measuring a campaign across channels
Posts belong to a channel, not to a campaign: fine, right up until a launch runs everywhere at once. Add a Campaigns table, tag posts to it, and the launch gets measured across every channel together: reach, engagement and growth attributed to the thing that caused them, not to the account that happened to carry them. Paid figures come in the same way, as does a content pillar or an owner per post.
Who it suits
The social lead reporting monthly on more than two accounts is the target user: along with the agency reporting to clients and the founder doing both jobs at once. Run a single account on a single platform, though, and the single-platform templates in the library are the closer fit: Instagram, Facebook, LinkedIn and TikTok each have their own.
Getting the numbers in
This is an import, not a live feed, and the difference is worth being exact about. YouTube connects directly as a source. Instagram, Facebook, LinkedIn and TikTok come in through Ferra's social import: re-runnable rather than continuous, and it has to be enabled on your workspace; where it isn't, the route that works today is the platform's own export or a Google Sheet somebody already maintains. Every path lands in the same place, so a channel loaded by export sits on the same chart as one that refreshes itself.
You may also like
Browse all templates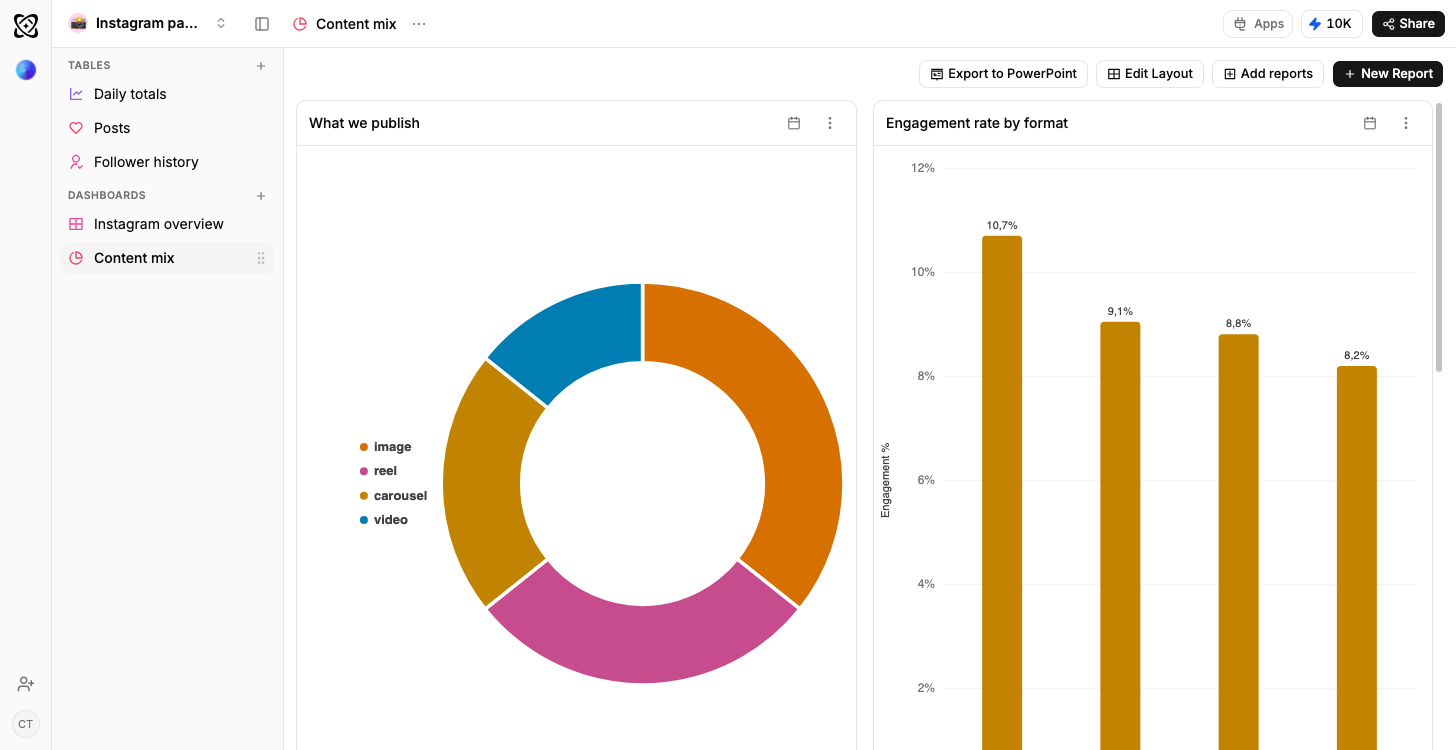
Sales pipeline
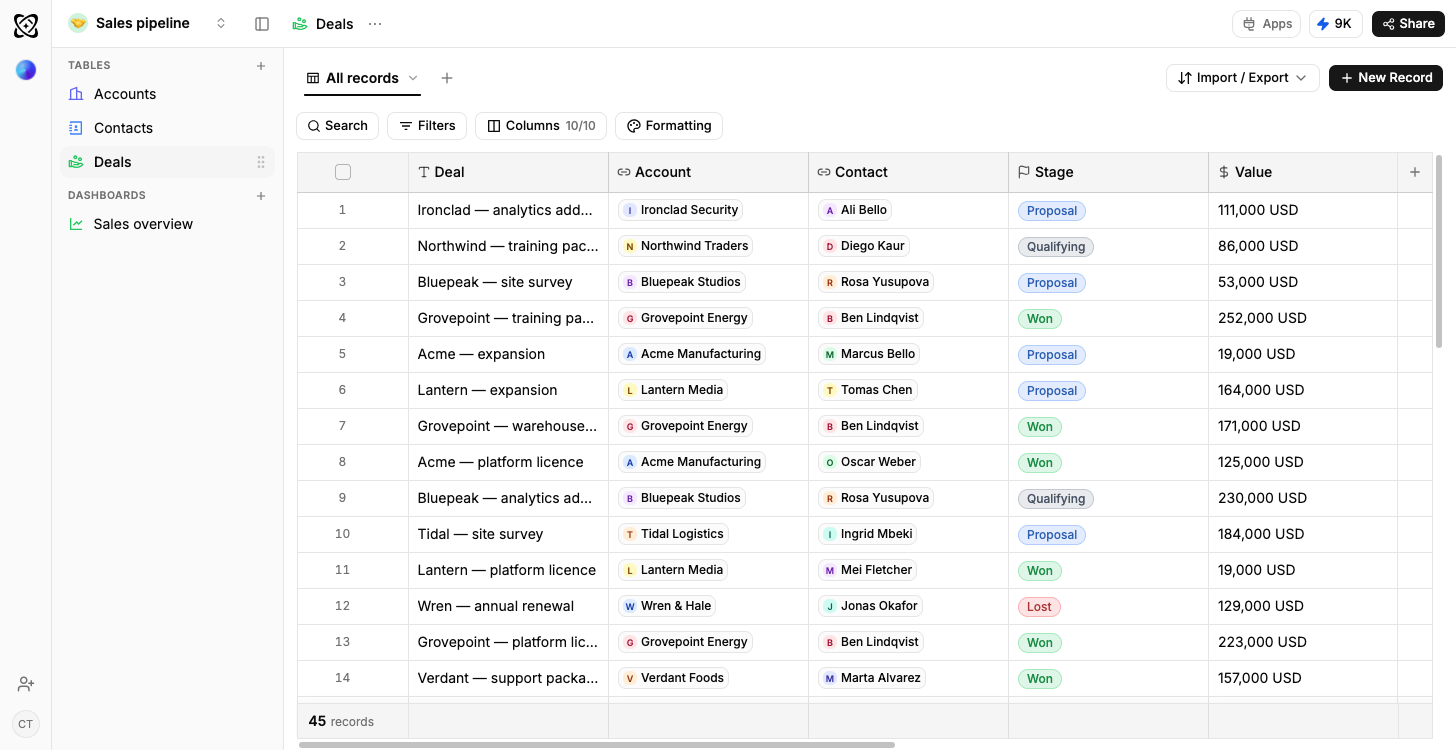
Open pipeline by stage, results by owner
Real estate
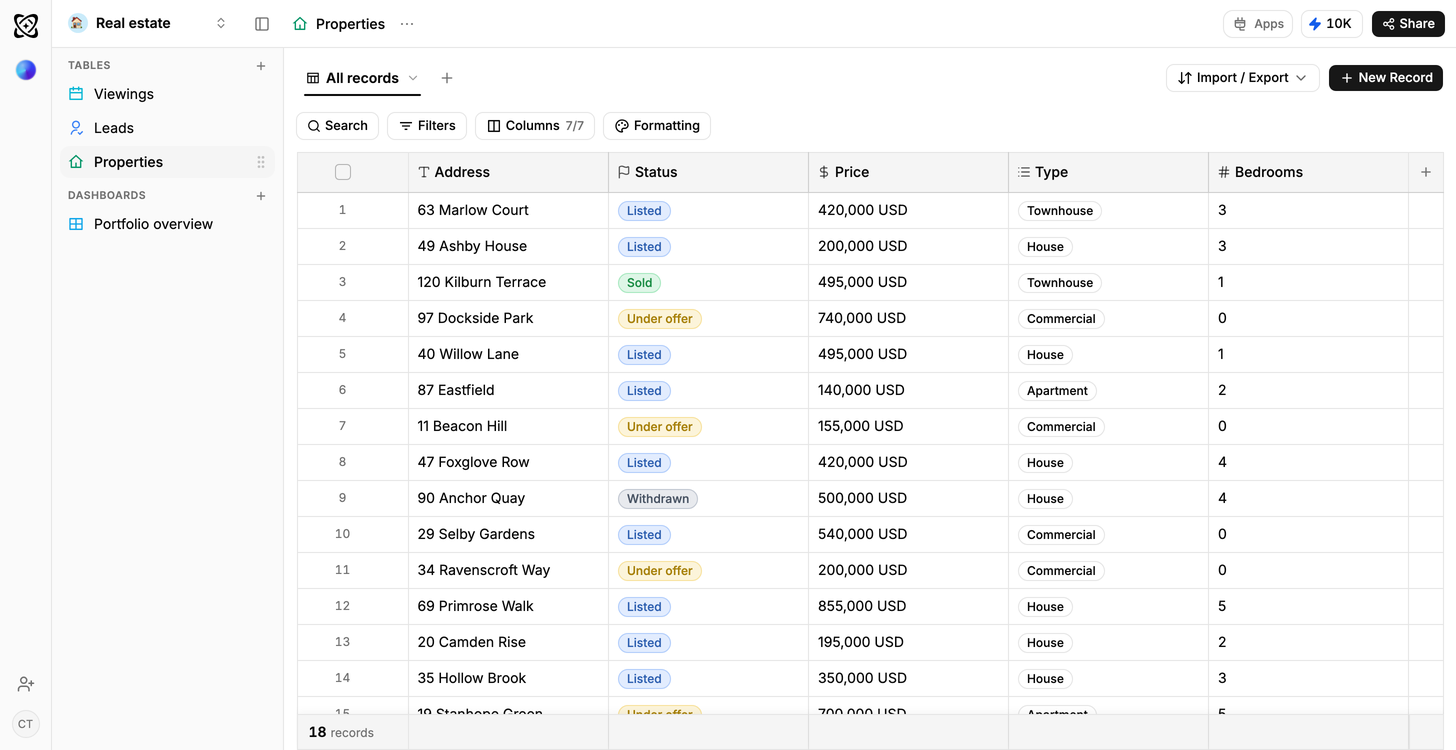
Portfolio value and leads, by stage
Recruiting
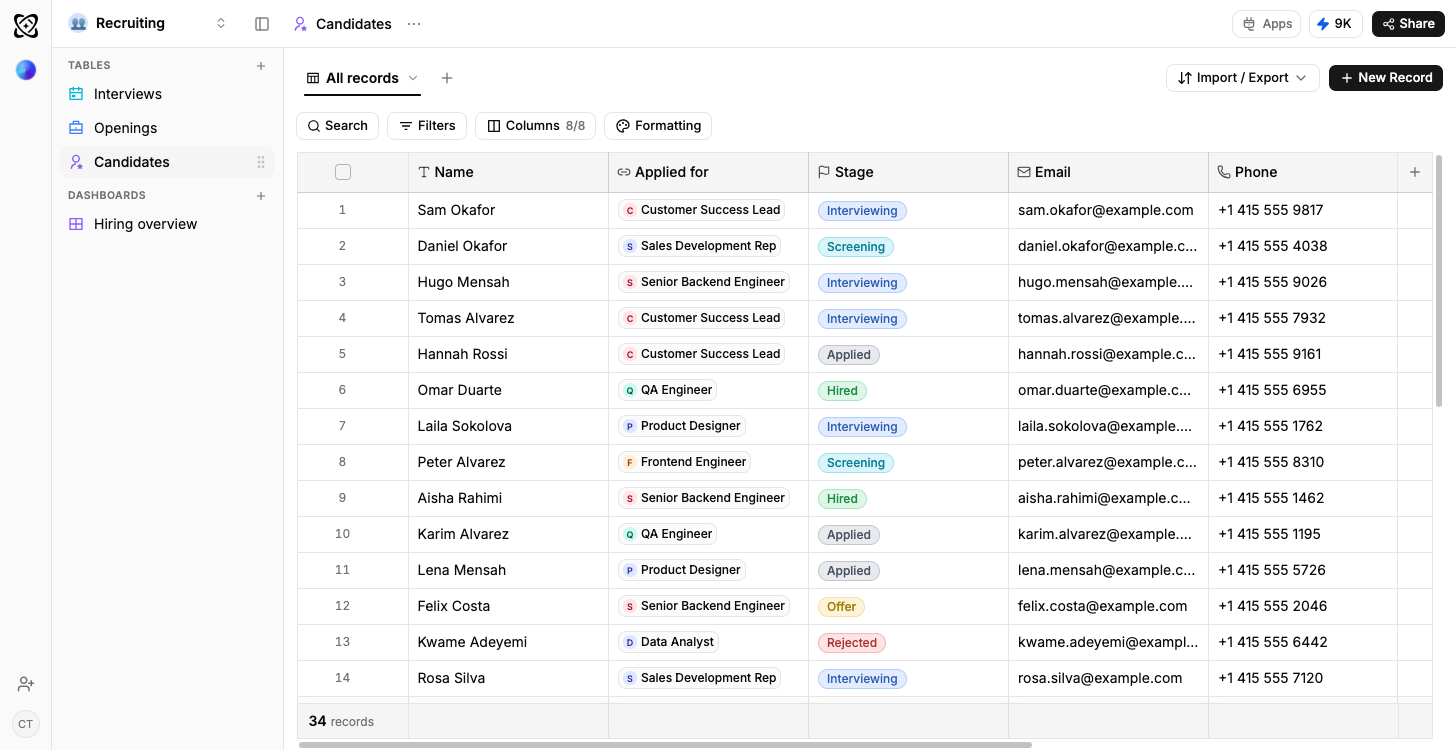
Candidates by stage, openings by status
Client work
Due this week; shipped but not billed
Frequently asked questions
The questions people ask before starting from the Social media analytics template.
Yes, through Ferra’s social import, which is re-runnable rather than continuous and has to be enabled on your workspace. YouTube is different again. It connects directly as a source. Where the social import is not enabled, the platform’s own export or a connected Google Sheet reads into the same tables, and that route works today.
Yes, and it is the reason the template exists. Every post and daily figure points at a channel, and the channel carries the platform, so reach and engagement sit on one set of axes.
As far back as you load. Daily performance and Audience growth accumulate on your side, so the history survives after the platform stops showing it.
Add a Campaigns table and tag posts to it, and a launch can be measured across every channel at once rather than one account at a time.
One date range, five platforms, one set of axes.
A channel row per account, a post row per thing you published and a daily row per channel, so the trend survives after the platform stops showing it.
Use template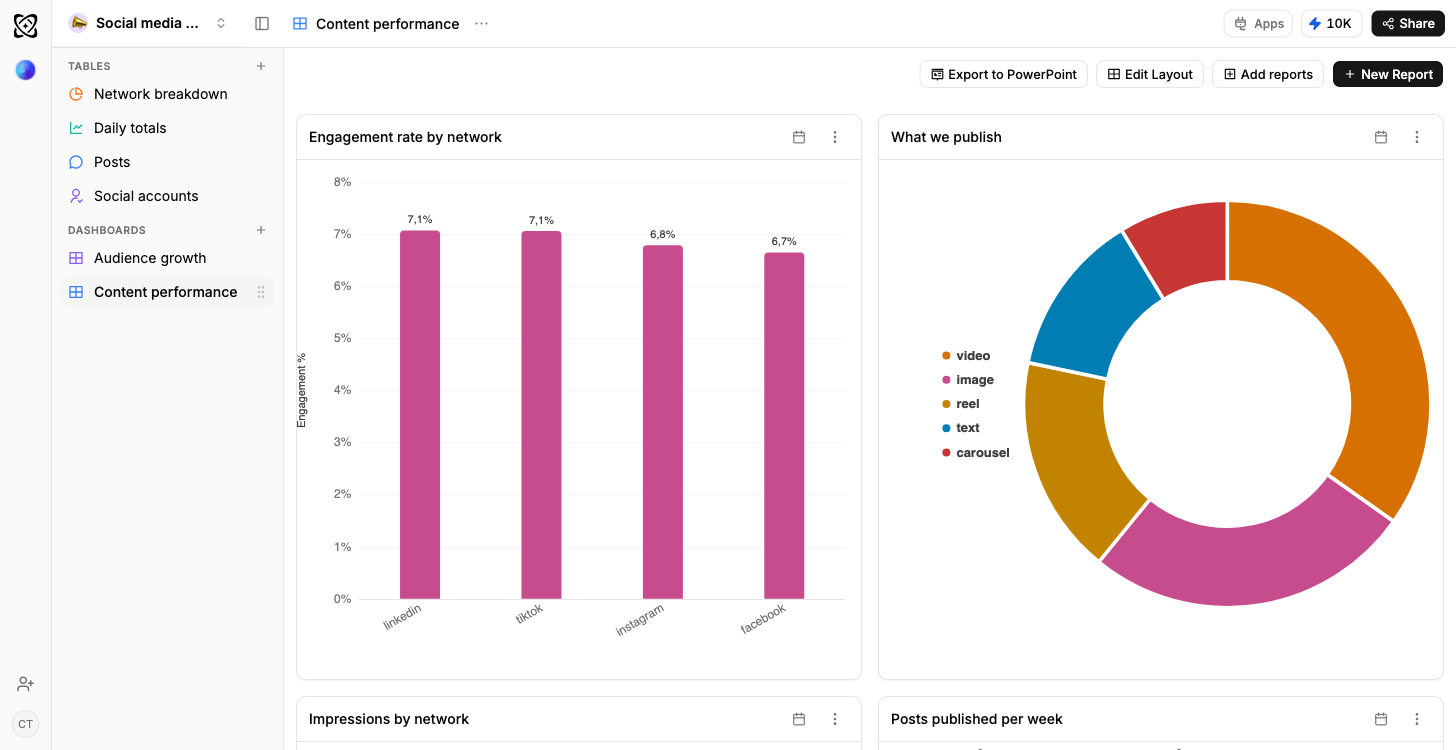
Five platforms, one set of axes
Reach, engagement and follower growth for every channel over the same date range: the comparison no single platform will ever show you.
How a dashboard gets builtThe history after the platform drops it
A daily row per channel accrues on your side, so a question longer than a month still has an answer next quarter.
Typed columns, explainedA carousel that carries here and dies there
Engagement rate is held by format and by platform, so what works where stops being something the team argues about from memory.
Ask it in a sentence