
Operations template
Vendors, orders and shipments, with orders in flight, delayed deliveries and spend by supplier on one dashboard.
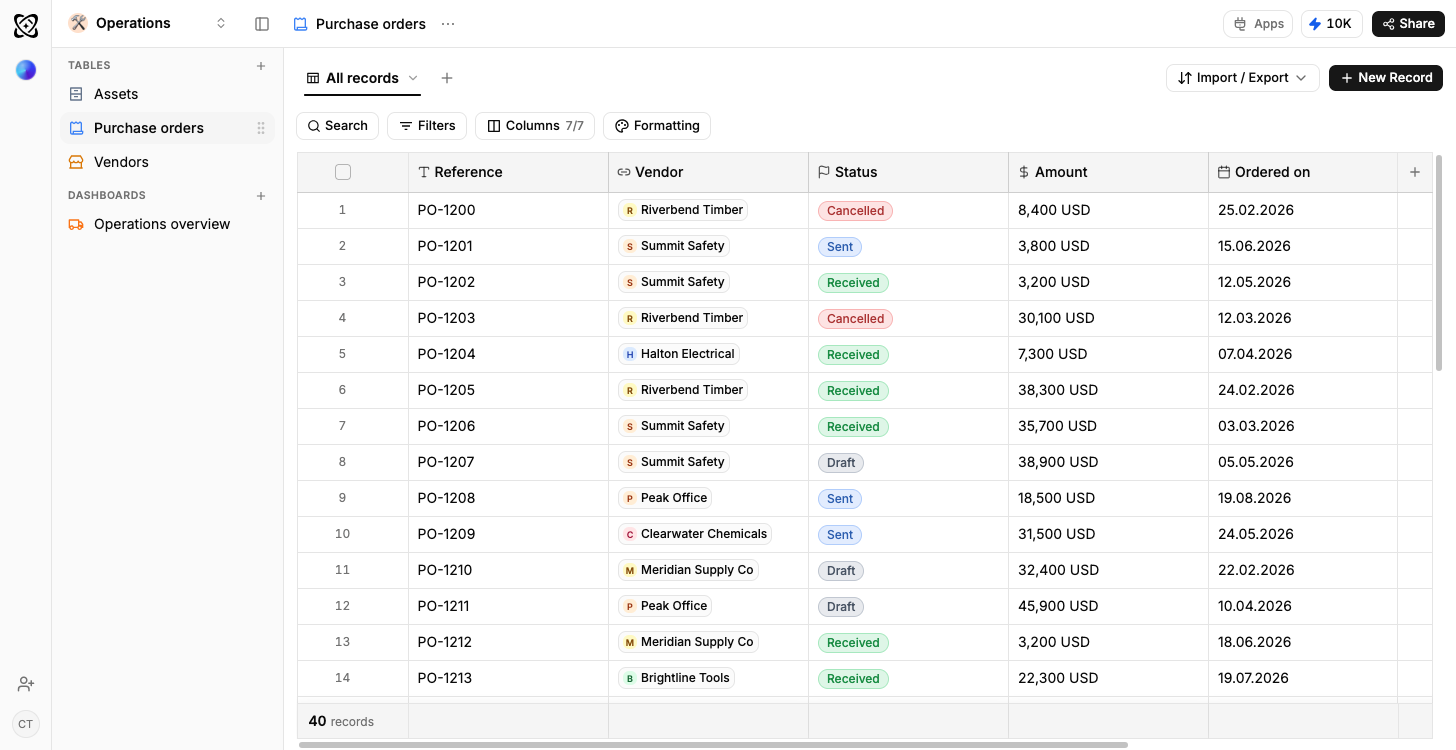
- Linked tables, not tabs
- Relationship columns join the rows instead of copying them into three places.
- Sample rows on arrival
- Every table opens with data in it, so the dashboards draw before yours does.
- Your own data, imported
- CSV, XLSX, a connected Google Sheet, or an email you forward straight in.
- Reshaped by describing it
- Say what is different and Ferra changes the structure and the rows together.
What is an operations tracker template?
Purchasing and receiving, in one workspace: the vendors you buy from, the orders you raise against them, and the shipments that turn up. Ferra's version links the three, derives how late each delivery actually was, and opens on two dashboards, orders in flight, and spend by supplier, with sample rows already in every table.
Purchasing usually lives across a spreadsheet, an inbox and somebody's memory of what a supplier promised. This template gives orders a vendor, shipments an order, and both a status you can group by, so an overdue delivery is a filter, and quarterly spend per supplier is a rollup rather than a pivot table somebody rebuilds each time. The sample rows include a couple of late shipments on purpose, so the dashboard shows what a bad week looks like.
Vendors, orders, shipments
One supplier, one row in Vendors, holding the terms you buy on: a category, an ordering contact, payment terms such as Net 30, the date you started buying, and a Spend to date column that's a formula over the orders attached to them. Orders is one row per purchase order: the PO number, the vendor it points at, the order date, a status, the value and the date it's expected. Shipments records one delivery per row against an order, with the carrier, the dispatch and arrival dates, a Days late column derived from those two dates, and a condition such as Short delivery for the times a pallet arrives with less on it than the paperwork says.
Three places at once
Purchasing usually lives in three places: a spreadsheet, an inbox, and somebody's memory of what a supplier promised on the phone. That holds up right until the person with the memory goes on leave. Give an order a vendor and a shipment an order, and the whole chain sits in one place; give both a status you can group by, and what's overdue stops being a question you ask someone and becomes a filter you apply. The chain runs the other way too: a vendor row totals its own spend because the orders point at it.
Why days late is a formula
A number somebody types is a number that stops being updated the first busy week. Days late is derived from the dispatched and arrived dates already sitting on the shipment row, so it's right every time you look at it and nobody owns keeping it current. It's also what makes supplier performance comparable at all: with lateness derived the same way for every delivery, the cheapest vendor and the most reliable one land on the same chart instead of in two different arguments.
The morning view and the quarterly one
Orders in flight is the morning view: everything approved and not yet received, with the overdue ones separated out and their vendor named rather than left in a list you have to sort first. Spend by supplier totals order value per vendor over the period and plots late deliveries beside it. The sample rows include a couple of late and short deliveries on purpose, so the dashboard shows you what a bad week looks like before you've had one.
Questions the rows answer
The morning starts with which orders are overdue and who the vendor is. Finance asks what we spent with each supplier last quarter. The one that changes a contract is which carrier is late most often, and by how many days. The warehouse needs what's arriving this week. All four read the same rows rather than a report somebody has to export first.
Adapting it, including stock
The first thing teams bolt on is stock. Add a Stock table linked to Orders and receiving a shipment moves what's on hand, instead of starting a second spreadsheet that immediately disagrees with the first. Approval steps? Multiple currencies? A goods-in check on every shipment? Describe the change and Ferra applies it to the structure and the rows already there, so existing orders don't end up with a blank column beside them.
Who it suits, and how to load it
It was built for teams raising purchase orders without a full ERP behind them: a small manufacturer, a retailer, a hospitality group. Loading it is an import, not a project: a CSV or XLSX of open orders, a supplier list out of your accounts package, or a Google Sheet that stays connected because someone else maintains it. Bring vendors in ahead of orders: orders need something to point at: then shipments last, and each import can be told which column names the row above it.
You may also like
Browse all templates
Client work
Due this week; shipped but not billed
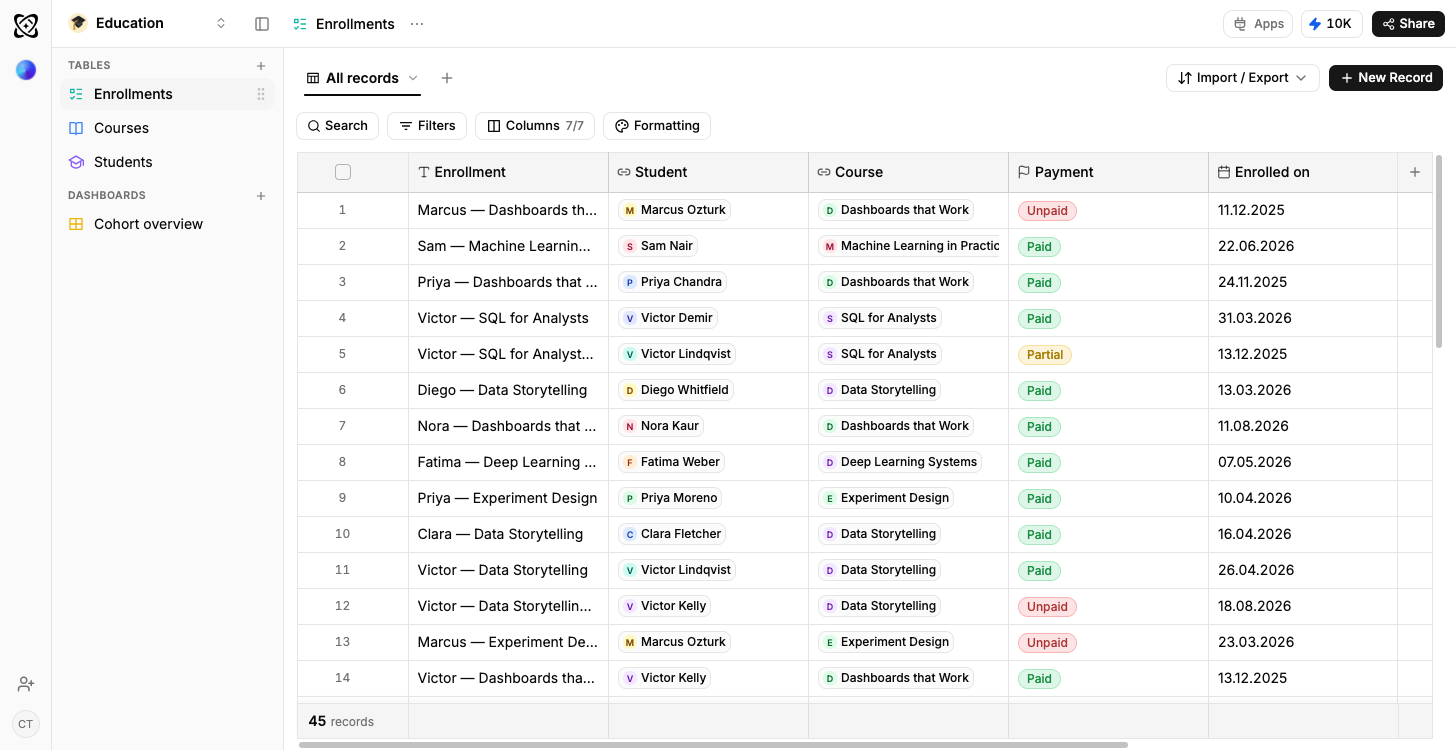
Education
Attendance and completion by cohort
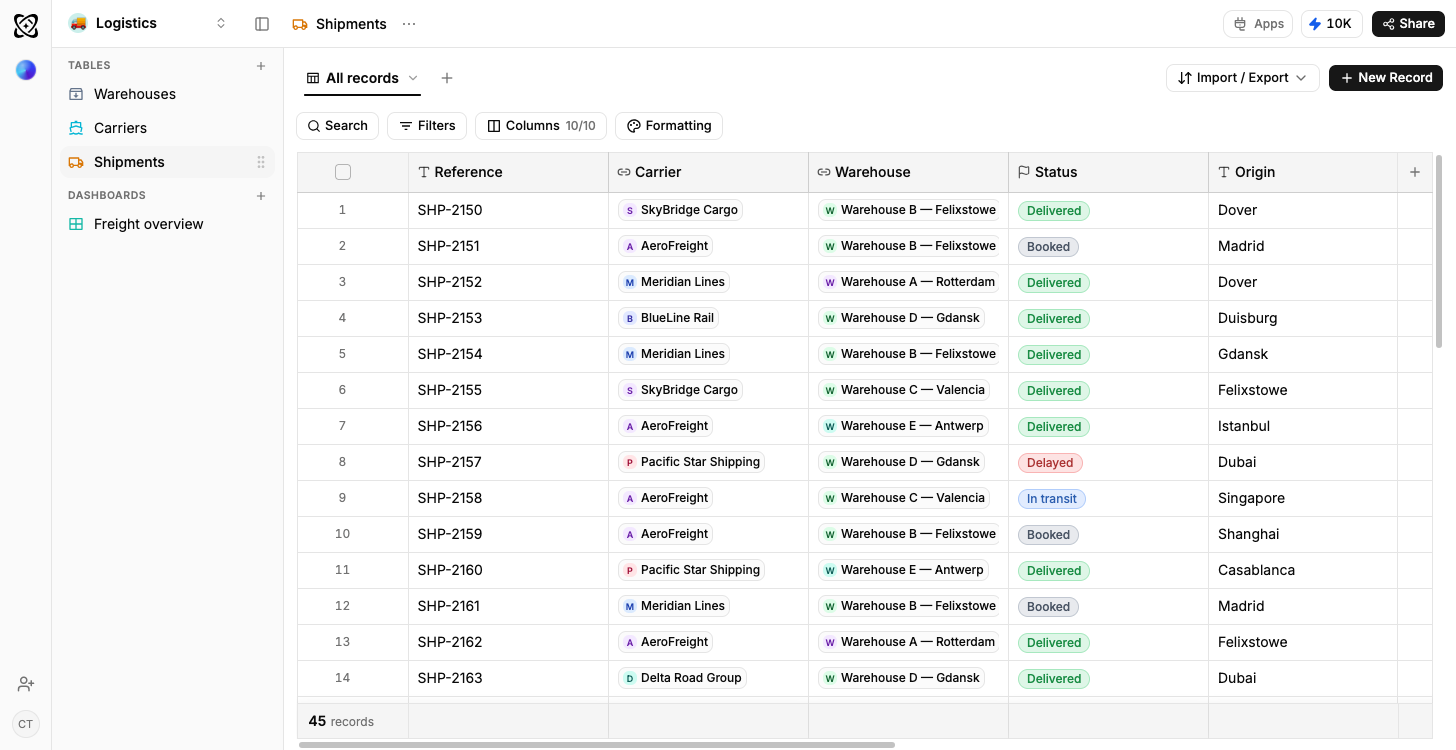
Logistics
On-time rate by carrier and lane
General workspace
Projects and budget by status
Sales pipeline
Open pipeline by stage, results by owner
Real estate
Portfolio value and leads, by stage
Recruiting
Candidates by stage, openings by status
Research
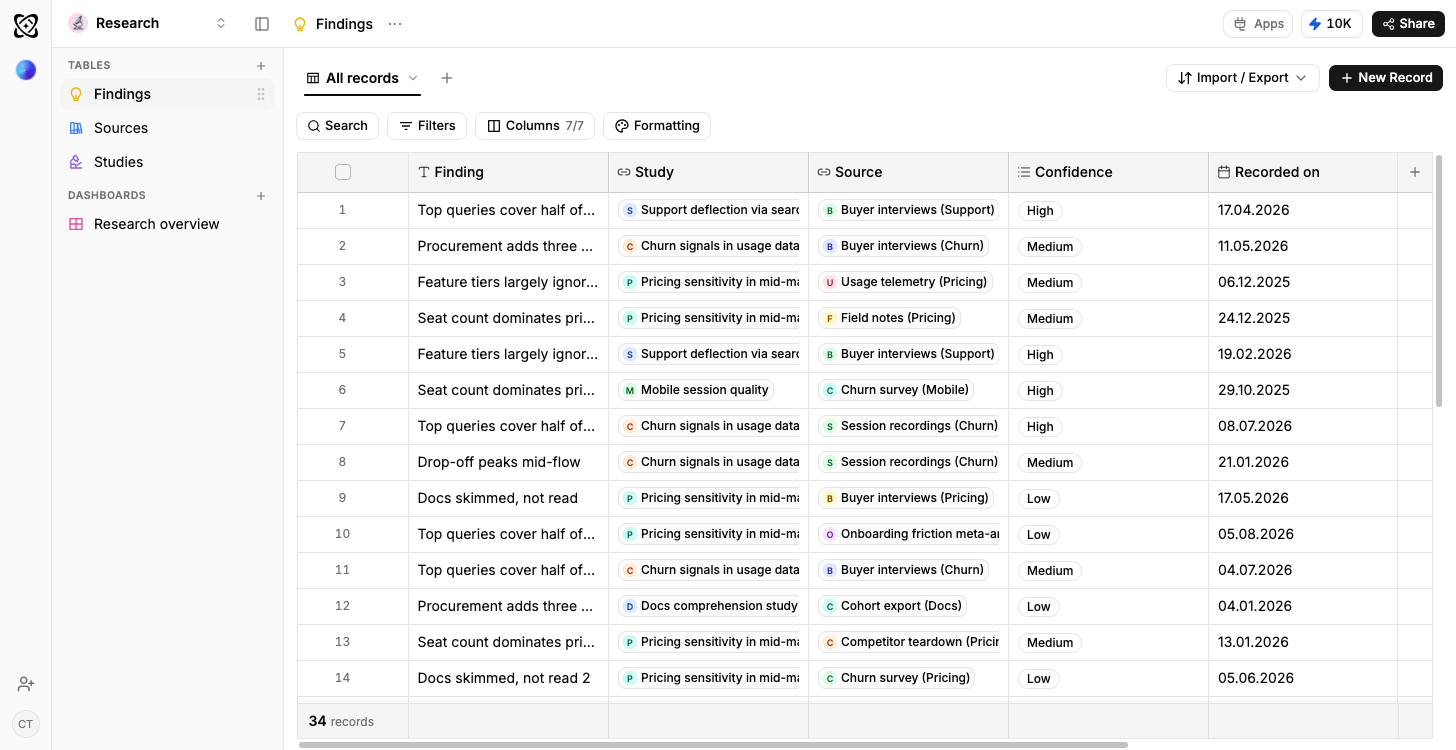
Findings per theme, by confidence and source
Frequently asked questions
The questions people ask before starting from the Operations template.
Not on arrival. Add a Stock table linked to Orders and receiving a shipment moves what is on hand, which is the usual first change people make to it.
It is a formula over the dispatched and arrived dates on the shipment row, so it is current every time the dashboard draws and nobody maintains it by hand.
Yes. Spend by supplier is one of the two dashboards it ships with, and each vendor row carries its own spend-to-date formula as well.
Yes, on the free plan with no credit card, and the sample vendors, orders and shipments are already in the tables when it opens.
Know what is in flight, and which supplier it is late from.
Orders point at a vendor and shipments at an order, and a couple of the sample shipments are already late, so you can see what a bad week looks like before you have one.
Use template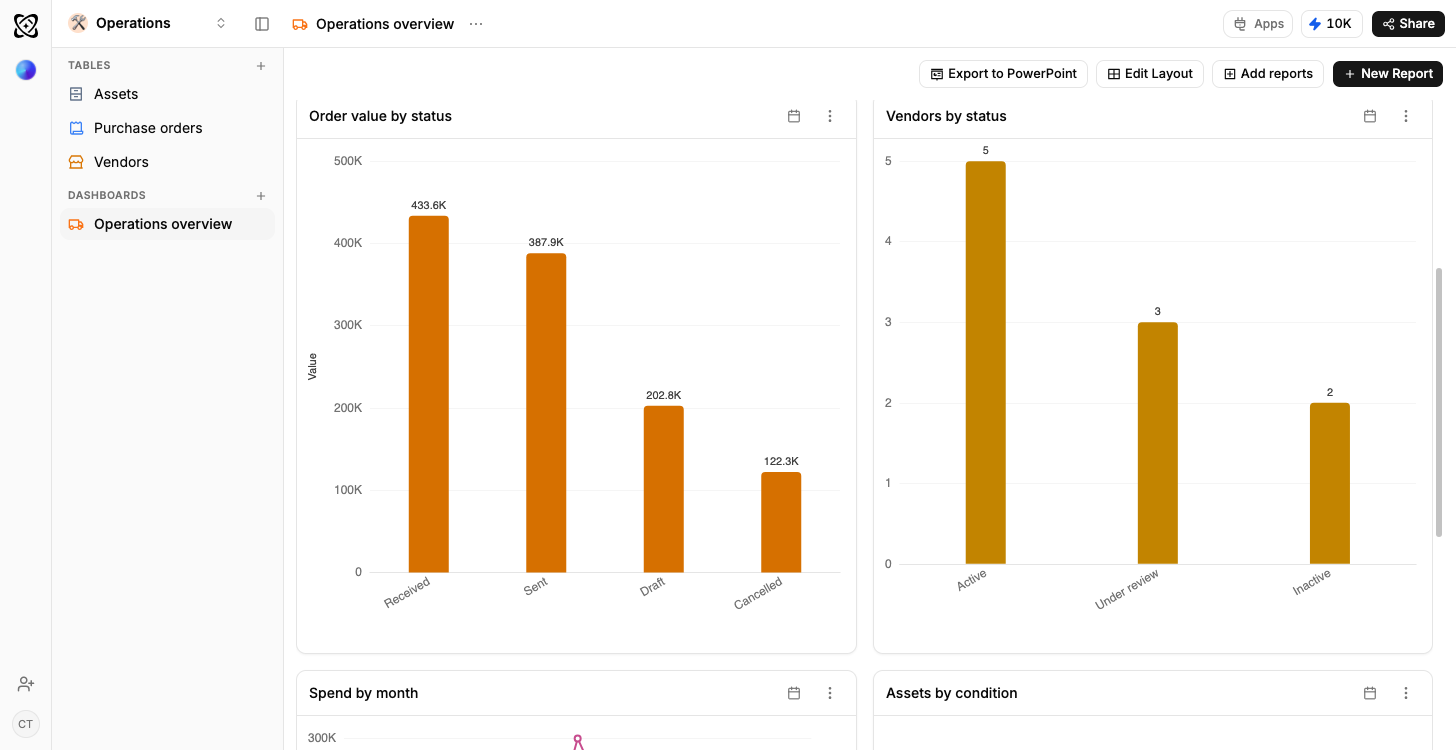
An overdue order names its supplier
Orders in flight separates the late ones and prints the vendor beside them, so the morning list does not need sorting first.
How a dashboard gets builtSpend per supplier, without a pivot table
Spend to date is a formula over the orders attached to a vendor, so the quarterly number sits on the row instead of being rebuilt.
How a derived column stays filledConfirmations arrive as mail and export
Forward an order confirmation in, or import the CSV your finance system produces; both land in the same purchase orders table.
Ways your data gets in