
Sales pipeline template
Deals, contacts and activity in three linked tables, with a dashboard for open pipeline by stage and by owner.
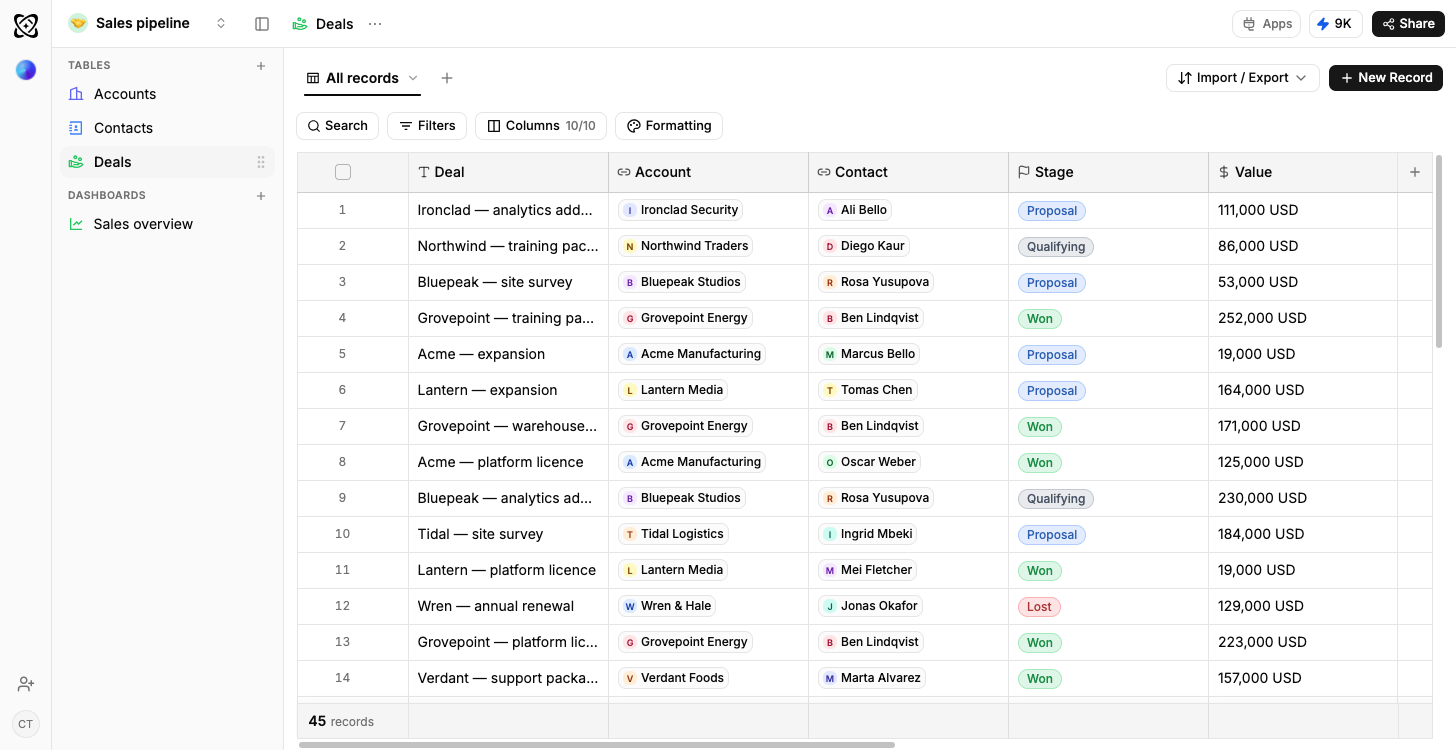
- Linked tables, not tabs
- Relationship columns join the rows instead of copying them into three places.
- Sample rows on arrival
- Every table opens with data in it, so the dashboards draw before yours does.
- Your own data, imported
- CSV, XLSX, a connected Google Sheet, or an email you forward straight in.
- Reshaped by describing it
- Say what is different and Ferra changes the structure and the rows together.
What is a sales pipeline template?
A ready-made structure for tracking opportunities from the first conversation to the closed deal: the deals and the people behind them, plus everything that happened in between. Ferra's version is three linked tables with sample rows already in them and two dashboards drawing over the top, so the shape is working before you've entered a single real deal.
The pipeline most teams keep in a spreadsheet right up until it stops being one. Deals carry a stage and a value, contacts carry the people those deals belong to, and every call, email and demo is logged against the deal it moved. Because the three tables are linked rather than copied, a rep is never updating the same deal in two places, and "what is actually open this quarter" is a chart rather than an afternoon of reconciliation.
The three tables, and what a row means in each
Deals is the spine, and one row is one opportunity: Northwind: 40 seats, Negotiation, $24,000, 12 Mar, Priya, Dana Whitfield: a deal name, a stage, a value in currency, a close date, an owner, and a relationship column pointing at the contact behind it. Contacts holds the people. Each row carries name, company, role, email and the date you last spoke, plus a formula column that totals the open value of every deal attached to them, so a contact row tells you what's riding on the relationship without anyone adding it up. Activity is the log: one row per thing that happened: a call, an email, a meeting or a demo, with the date, the notes, the next step, the owner, and a link back to the deal it moved.
Why linking beats a second tab
A deal gets updated on one tab but not the other. Somebody spells a company name two ways. Before long the total at the bottom quietly disagrees with the rows above it, and none of that is the sheet failing, it's the second person touching it. A relationship column fixes this at the root: the join becomes something the software knows about rather than something a person maintains. The Contact column on a deal points at a row in Contacts, and every logged activity points back at the deal it belongs to. Nothing is typed twice, so there's nothing to reconcile on a Friday afternoon.
The two dashboards that ship with it
A stage that's quietly clogging up shows as a bar, not as a feeling somebody has in the Monday meeting: that's Pipeline by stage, open value in each stage with the number of deals sitting in it. Results by owner covers the review itself: closed value per rep for the period, win rate beside it, and the deals that slipped their close date, which are the three numbers a pipeline review actually turns on. Both are drawing when the workspace opens, because the sample rows are real rows rather than placeholders.
Questions you can ask in a sentence
Which deals have had no activity in the last two weeks? That's a question about the Activity table and the dates on it. You type it instead of building the view. What's my open pipeline for March, broken down by stage, reads Deals. Who has the best win rate on deals over twenty thousand dollars crosses value with outcome and owner. And a summary of everything that has happened on the Northwind deal walks the link from one deal to every activity row attached to it.
Adapting it to how you actually sell
Your stages won't match these: nobody's do, and they're a starting point rather than a format you have to live inside. Describe the change and Ferra applies it to the structure and to the rows already in the table: add a Security review stage before Negotiation and the three deals waiting on one move into it, switch the currency, split Activity by channel, or add a renewals table linked to Deals. What you're not left with is a new column and three hundred blank cells under it.
Who it suits
Founder-led sales teams live here. So do agencies chasing new business, and anyone standing up a first CRM for two to twenty reps: any team whose pipeline currently lives in a shared spreadsheet that has started to disagree with itself. Already running a heavily customised CRM with quoting, product catalogues and territory rules behind it? Keep it, and use this for the reporting that system makes hard to get out.
Getting your existing pipeline in
Start with what you have. A CSV or XLSX export from your current sheet or CRM drops straight into Deals and Contacts, a Google Sheet can stay connected so it keeps updating, and an email can be forwarded in and read into a table. Order matters a little: deals first, then contacts, then a sentence on how the two match up. Ferra sets the relationship column from that rather than leaving you to paste keys between tabs.
You may also like
Browse all templates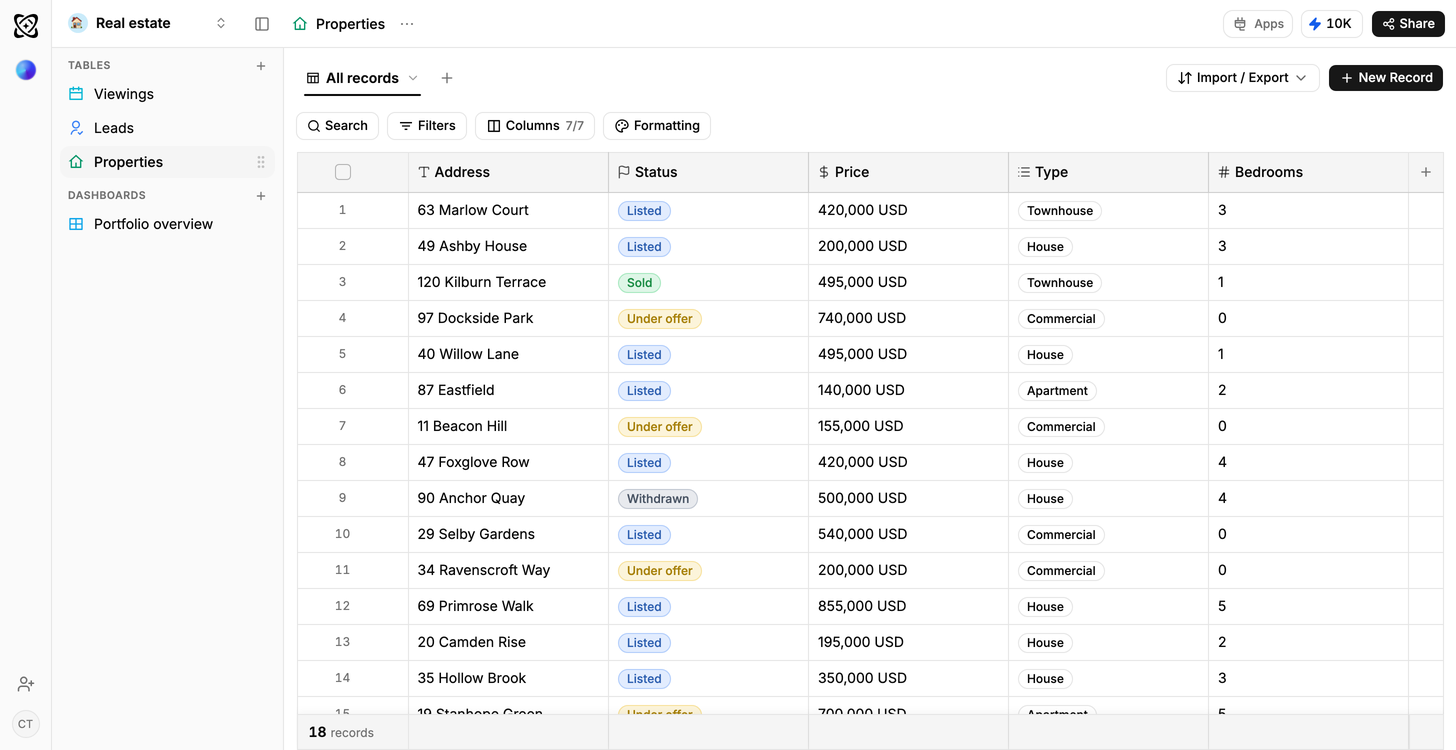
Real estate
Portfolio value and leads, by stage
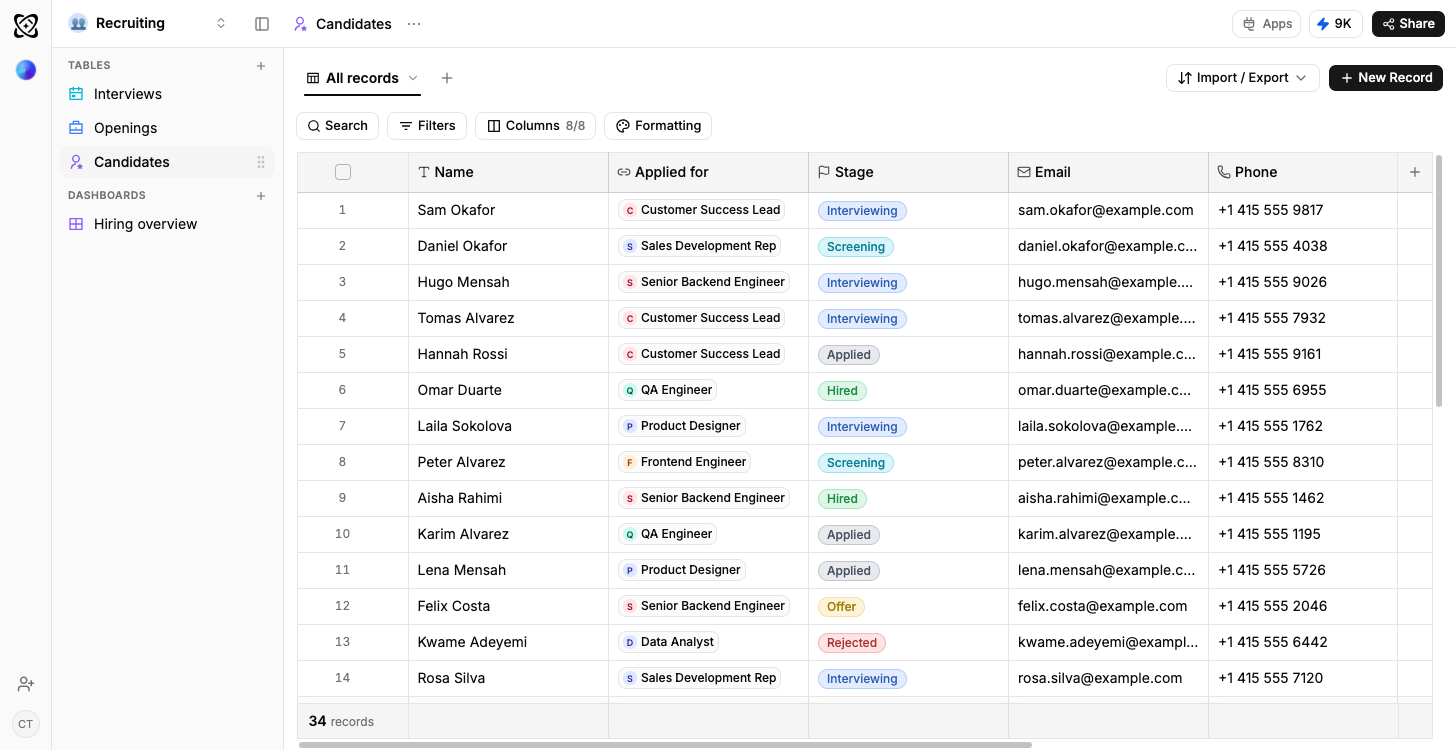
Recruiting
Candidates by stage, openings by status
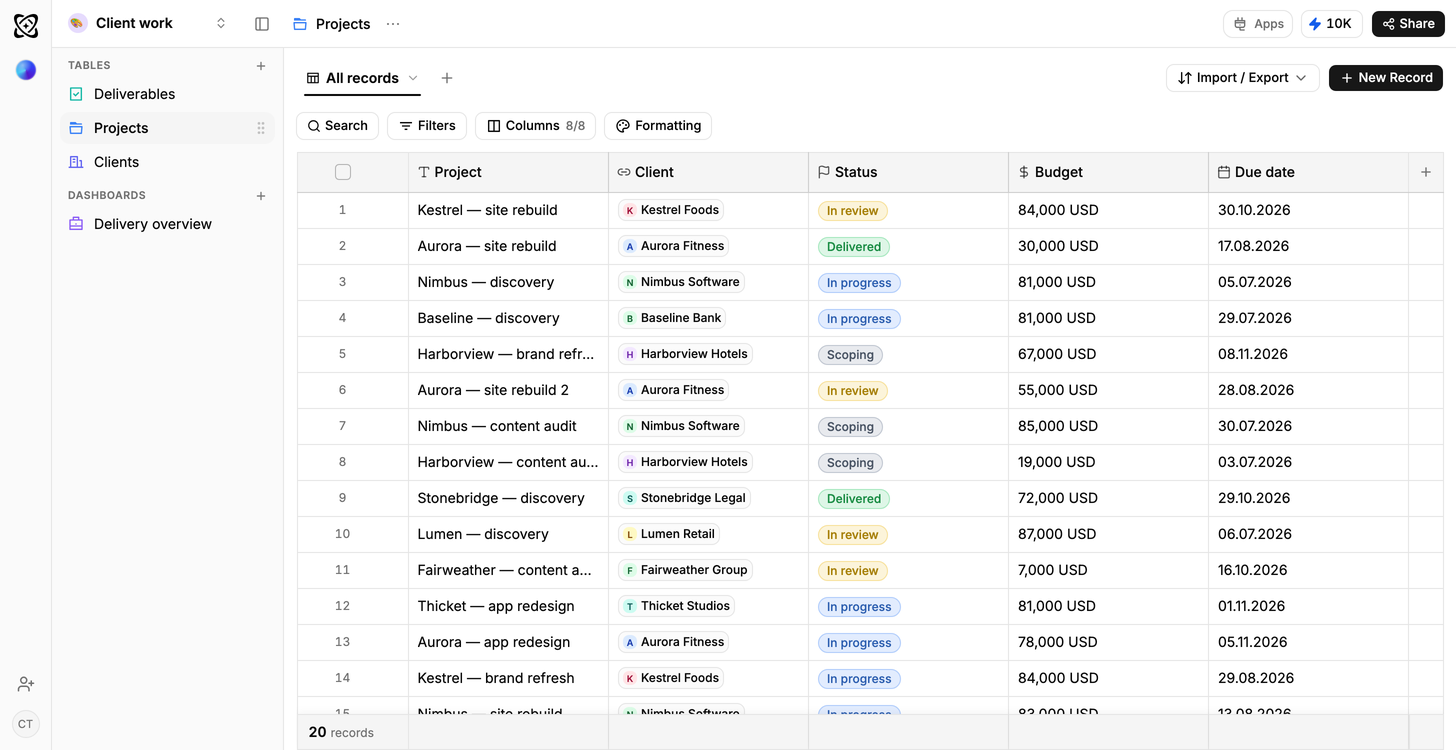
Client work
Due this week; shipped but not billed
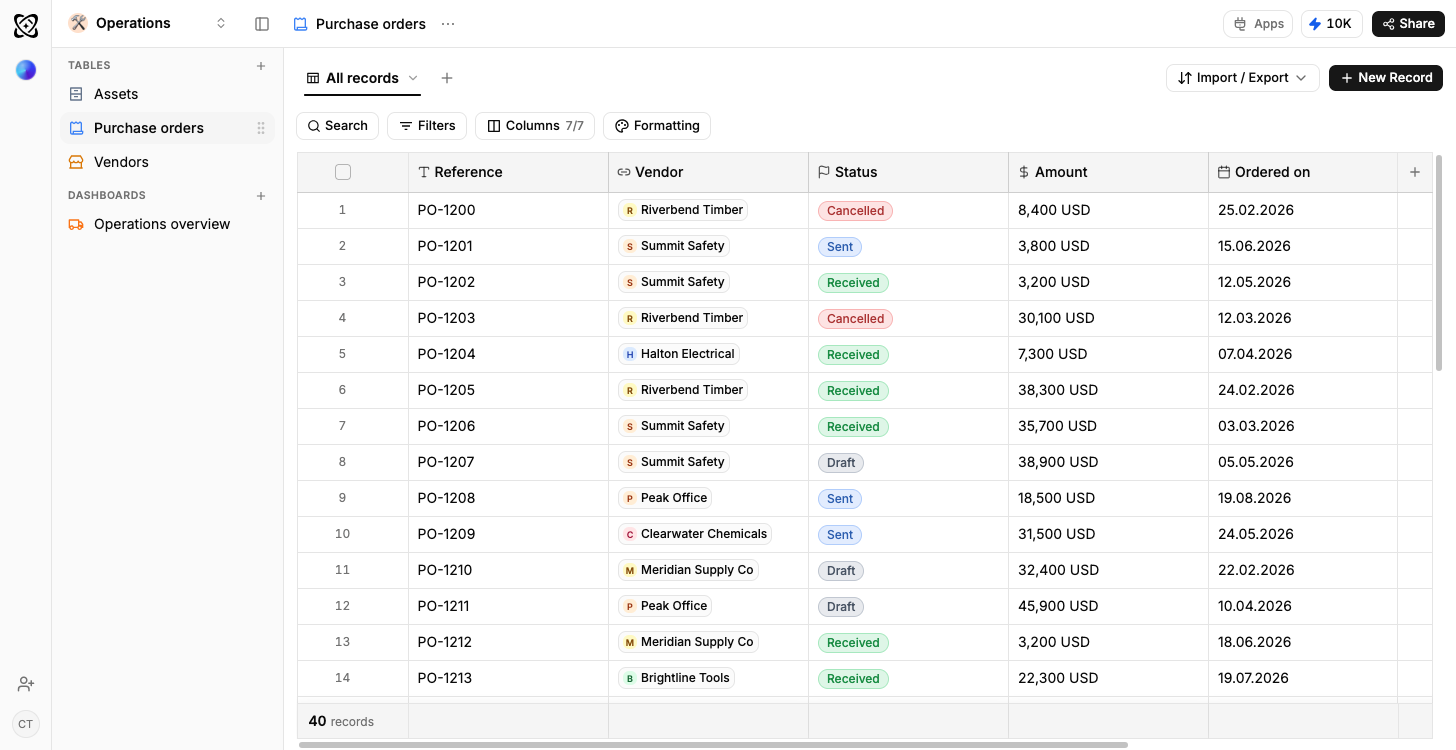
Operations
Orders in flight, spend by supplier
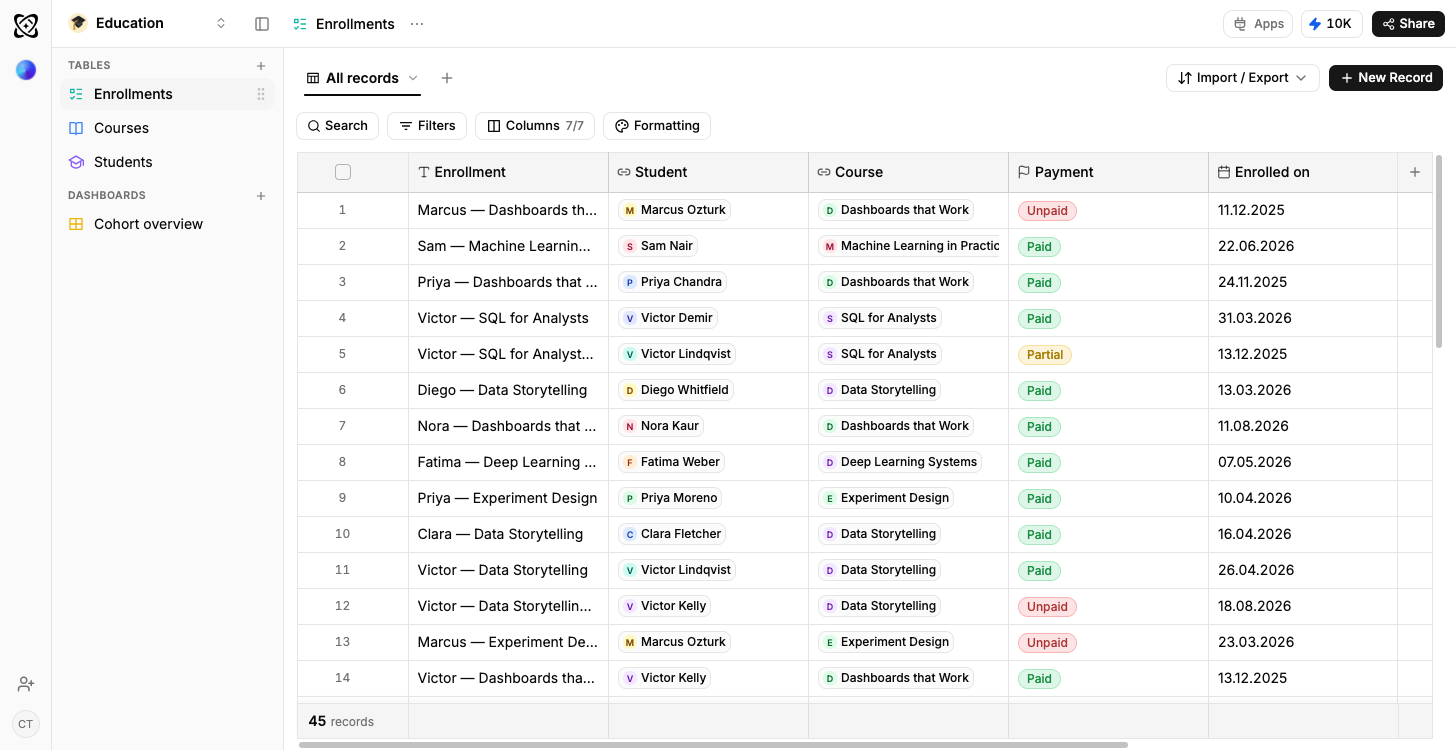
Education
Attendance and completion by cohort
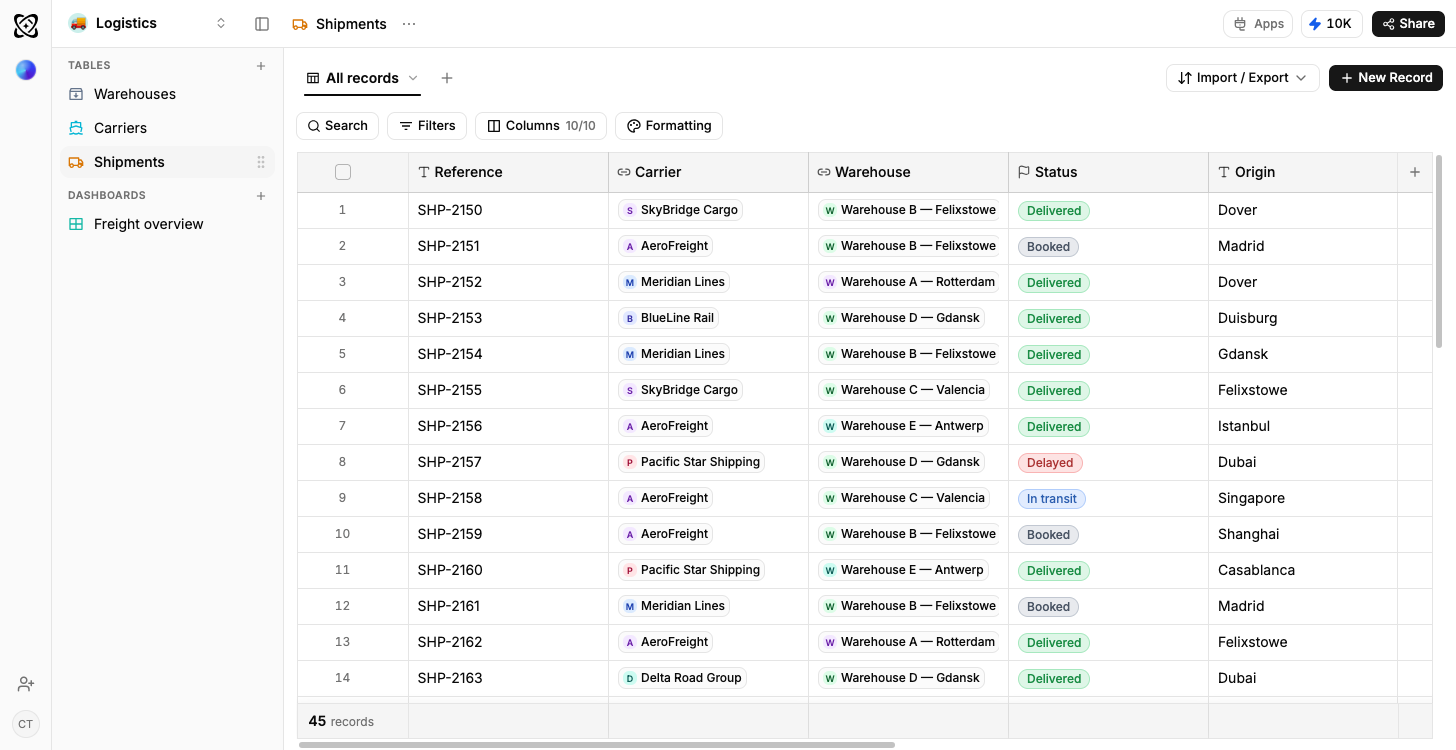
Logistics
On-time rate by carrier and lane
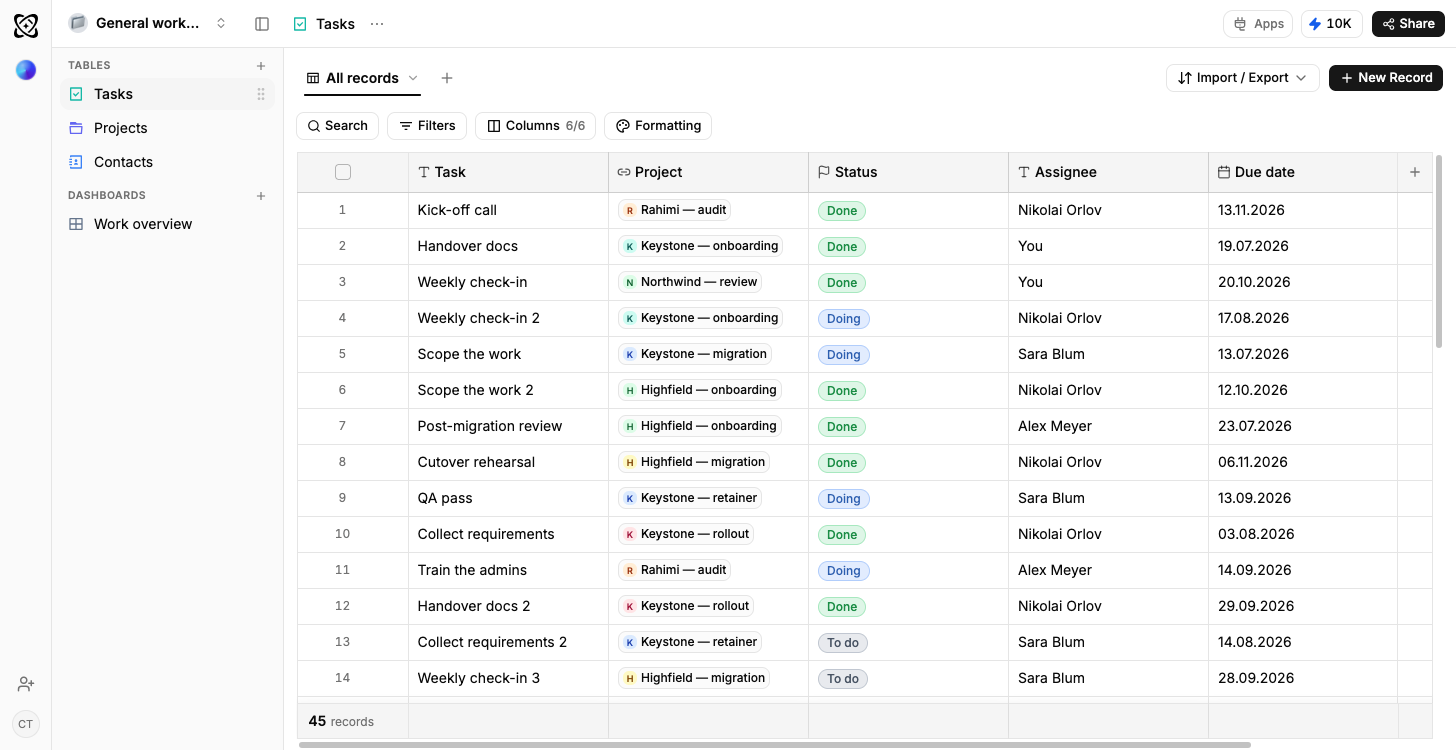
General workspace
Projects and budget by status
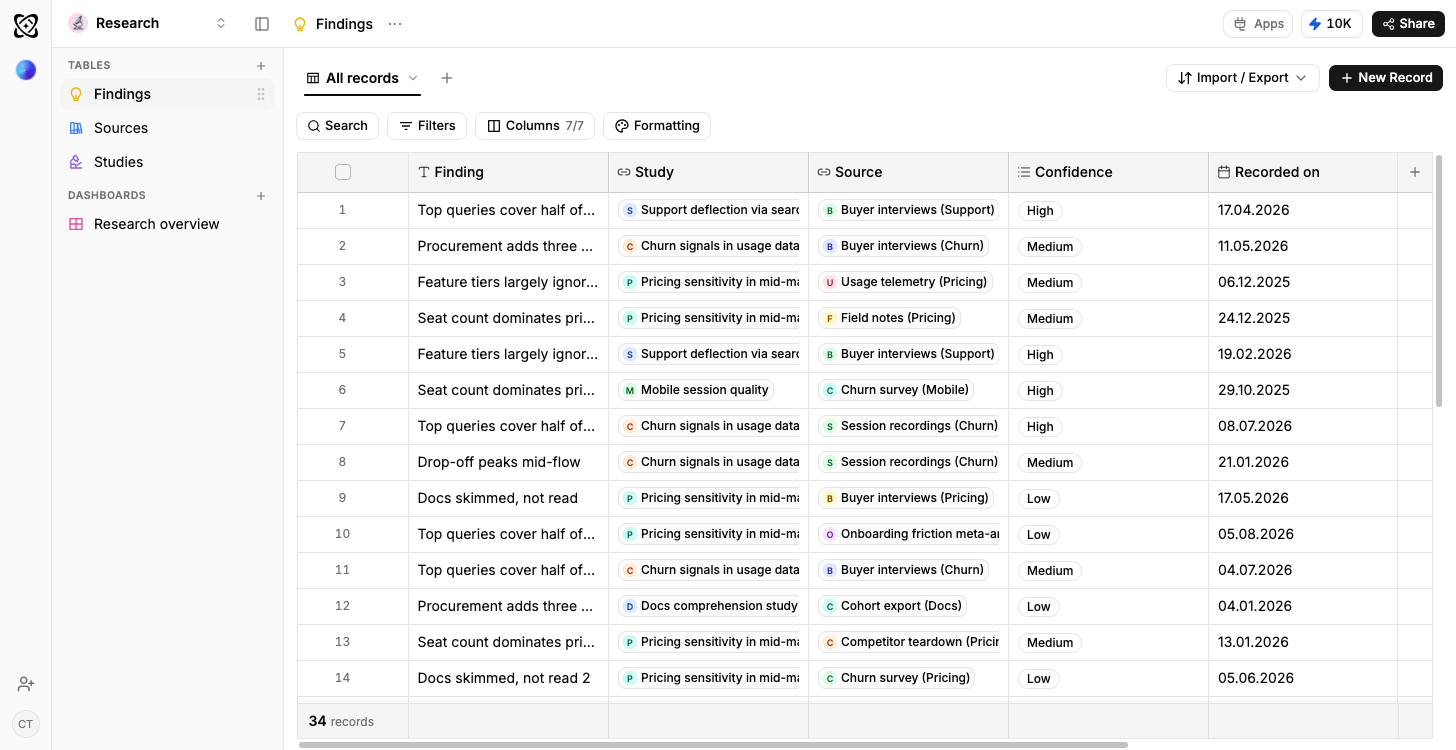
Research
Findings per theme, by confidence and source
Frequently asked questions
The questions people ask before starting from the Sales pipeline template.
Yes. It opens on the free plan with no credit card, and the template you picked travels with you through sign-up, so you land in the workspace with the sample deals already in it rather than on an empty page.
Yes, and you change them by describing the change. Adding a stage, renaming one or reordering them applies to the structure and to the deals already sitting in it, so no row is left without a stage.
Yes. CSV and XLSX import directly, a Google Sheet can stay connected, and a forwarded email can be read into a table. Deals and Contacts are separate tables, so import both and say how they match up.
Two dashboards. Pipeline by stage shows open value and deal count in every stage; results by owner shows closed value, win rate and the deals that slipped their close date.
Stop updating the same deal in two places.
Deals, contacts and every call logged against the deal it moved, with open value by stage drawing before you have entered a real one.
Use template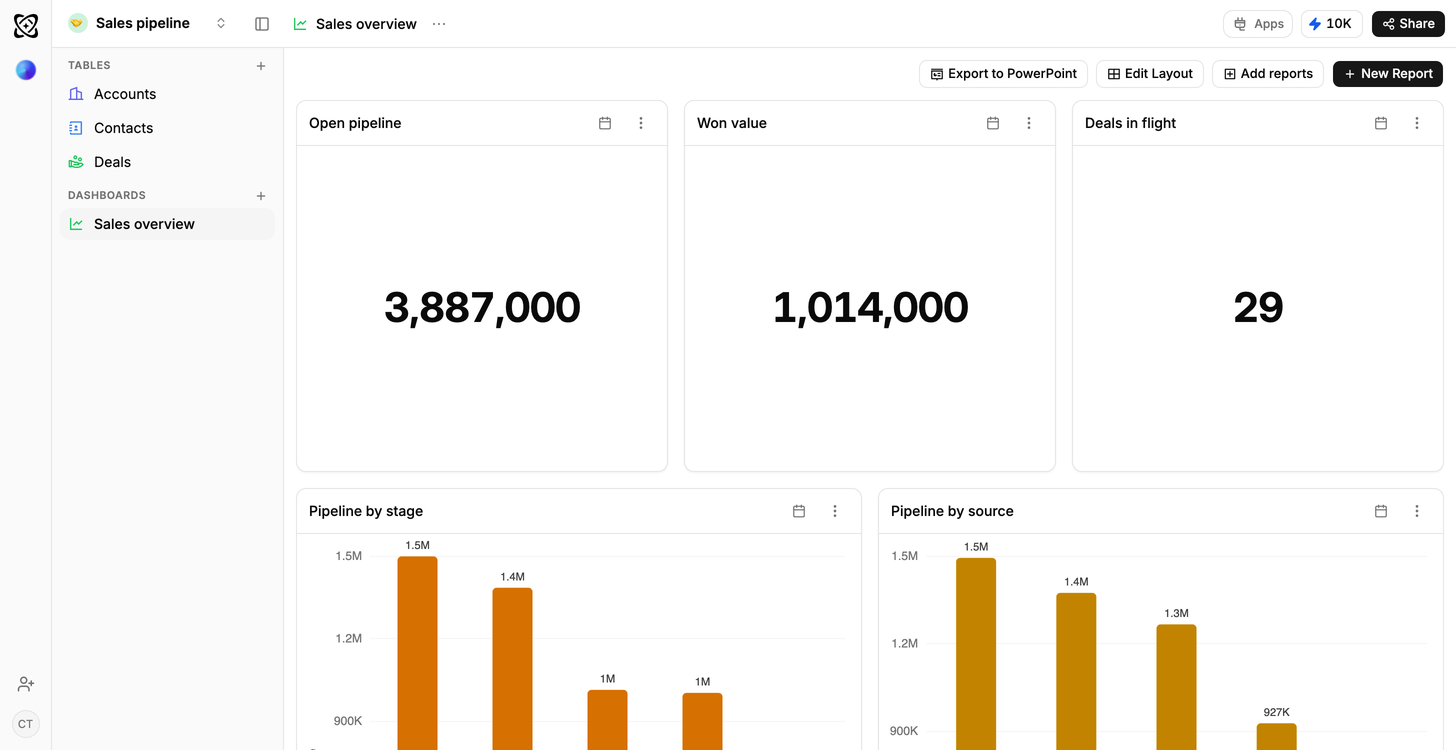
Every call sits on the deal it moved
Activity rows point back at a deal, so the whole Northwind history is on the row rather than somewhere in an inbox.
How relationship columns workOpen value by stage, on day one
Pipeline by stage draws off the sample deals the moment the workspace opens, with results by owner and slipped close dates beside it.
How a dashboard gets builtThe spreadsheet you already argue with
Import deals and contacts, say how the two match up, and Ferra sets the relationship column instead of leaving you pasting keys.
Ways your data gets in