
How do you calculate average order value?
AOV = total revenue / number of orders
One division: total revenue over number of orders, same period for both. $45,000 across 600 orders is an average order value of $75: what a typical customer spends each time they check out.
AOV caps what you can afford to spend acquiring a customer, so read it next to CAC when judging a channel's economics. It's also a mean, and a few large orders drag it up: check the median when order sizes vary widely. Bundling raises it, and so do free-shipping thresholds and checkout cross-sells.
Upload your order export to Ferra and ask for AOV by month, product line, or customer segment: plain English in, answer out.
How the average order value calculator works
Revenue and order count have to cover the same period: pull both from one sales report and one date range. A month, a quarter, or a single campaign window all work when the two figures match.
- Total revenue
- Gross order revenue for the period from your sales or e-commerce reporting. Most teams exclude sales tax and net out refunds. Shipping charges can go either way, pick a definition and keep it identical every period.
- Number of orders
- Orders placed in the period, not units, not customers. An order holding three items is one order; a customer who buys twice counts twice.
Calculating average order value
Suppose last month's report shows $24,000 in revenue across 300 orders. One division answers the question.
24,000 ÷ 300 = $80, the worth of an average checkout. Track it monthly and it turns into a sensitive gauge: a discount-heavy month shows up as a dip almost immediately, and so does a pricing or merchandising change.
The denominator is where this goes wrong. Divide by units sold and AOV reads low whenever baskets hold more than one item; divide by unique customers and it reads high whenever anyone orders twice. Mismatched periods do the same damage, a quarter of revenue over a month of orders produces a confident, wrong number.
When to use average order value
An $80 average is high for coffee and low for furniture: there's no universal benchmark, so AOV earns its value through comparison. Track it against your own history and it catches drift from discounting or a shifting product mix. Pair it with customer acquisition cost: AOV, together with margin and repeat purchase rate, sets the ceiling on what you can afford to pay for a customer.
It also sits behind everyday merchandising calls. A free-shipping threshold works best set modestly above current AOV, close enough that customers add one item to qualify. Segment by channel, device, or new-versus-returning customers to see where the valuable orders come from, and compare before and after a bundling or upsell test to learn if the tactic moved basket size at all.
How to raise average order value
AOV grows two ways: customers add more items, or they trade up to pricier ones. Neither needs more traffic.
- Set a free-shipping threshold
- Put it slightly above current AOV and show shoppers how far they are from qualifying. Plenty will add an item rather than pay for shipping.
- Bundle complementary products
- Related items packaged at a small discount sell two or three products where one would have sold, the order total rises even after the discount.
- Recommend at checkout
- 'Frequently bought together' rows and low-priced add-ons at the cart page catch impulse additions once the decision to buy is already made.
- Offer volume discounts
- Buy-two-get-10%-off tiers trade a little per-unit margin for meaningfully bigger orders. Run the math against your margins before launching.
- Add a premium option
- A higher-priced version of a bestseller lifts AOV through everyone who trades up, and makes the standard version look like the sensible buy to everyone else.
Other calculators
Browse all calculatorsRelated templates
Browse all templates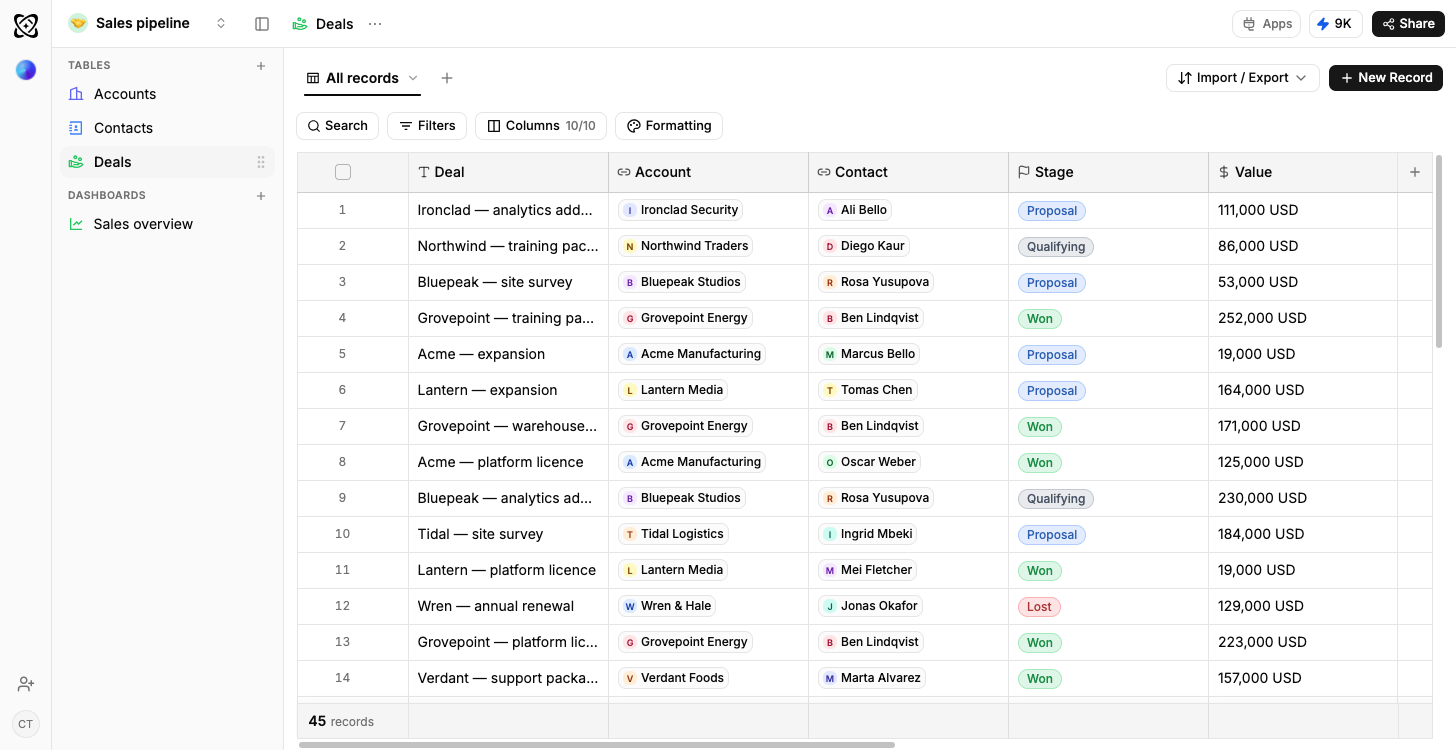
Sales pipeline
Open pipeline by stage, results by owner
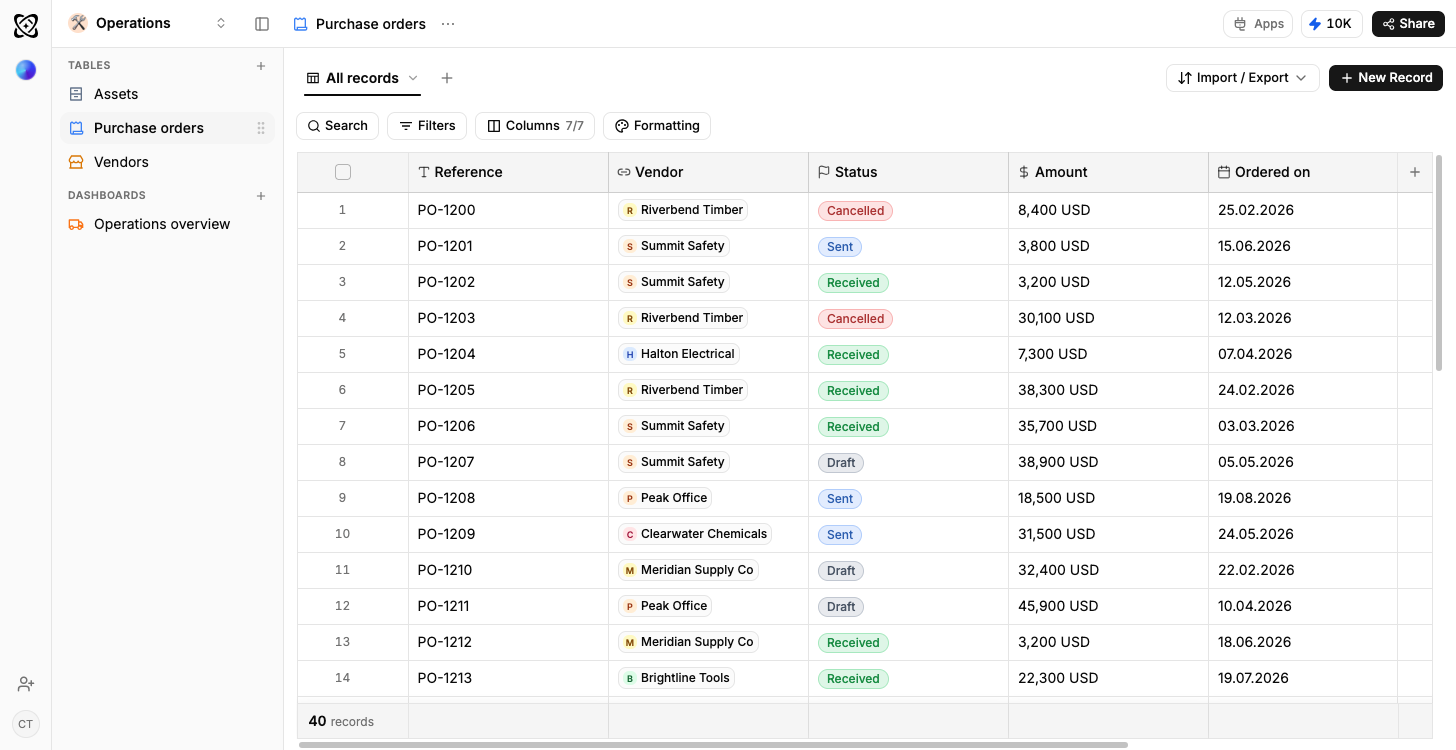
Operations
Orders in flight, spend by supplier
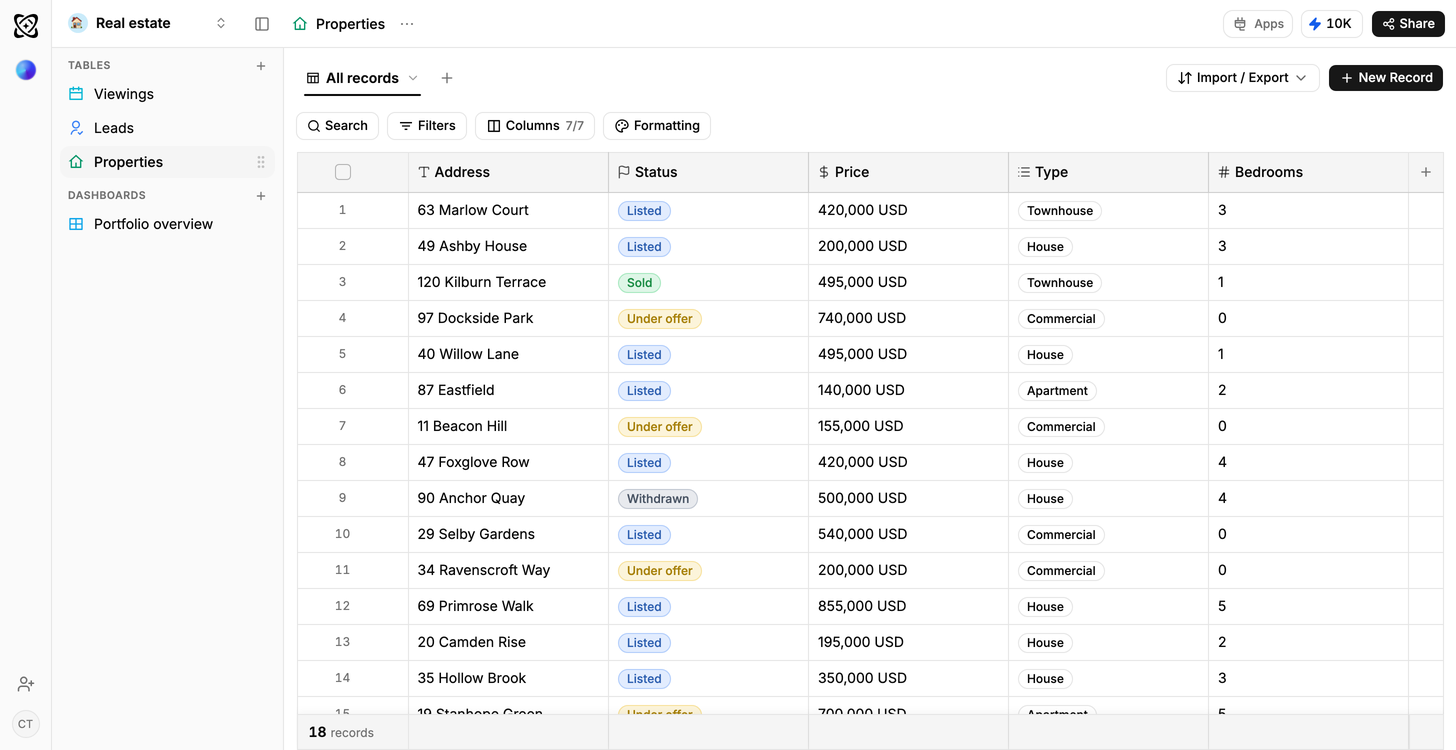
Real estate
Portfolio value and leads, by stage
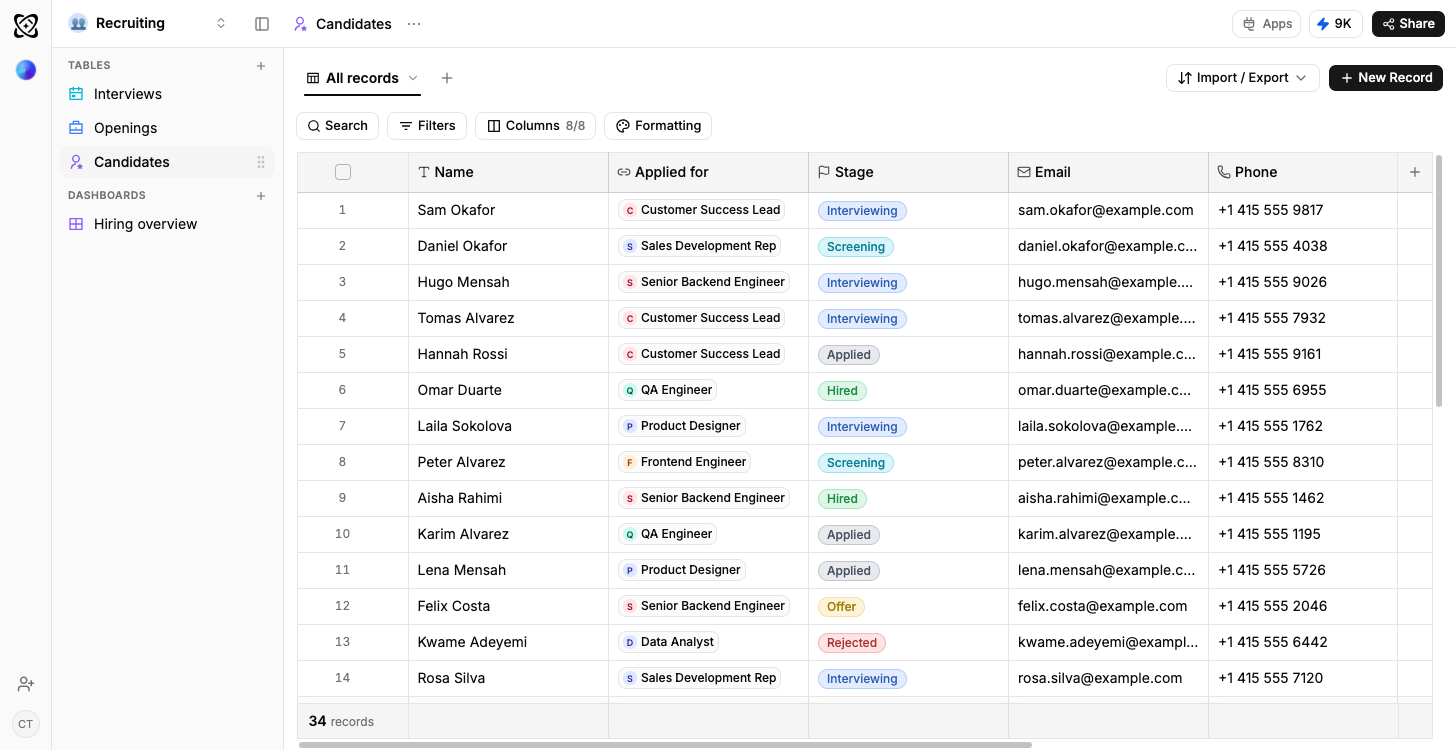
Recruiting
Candidates by stage, openings by status
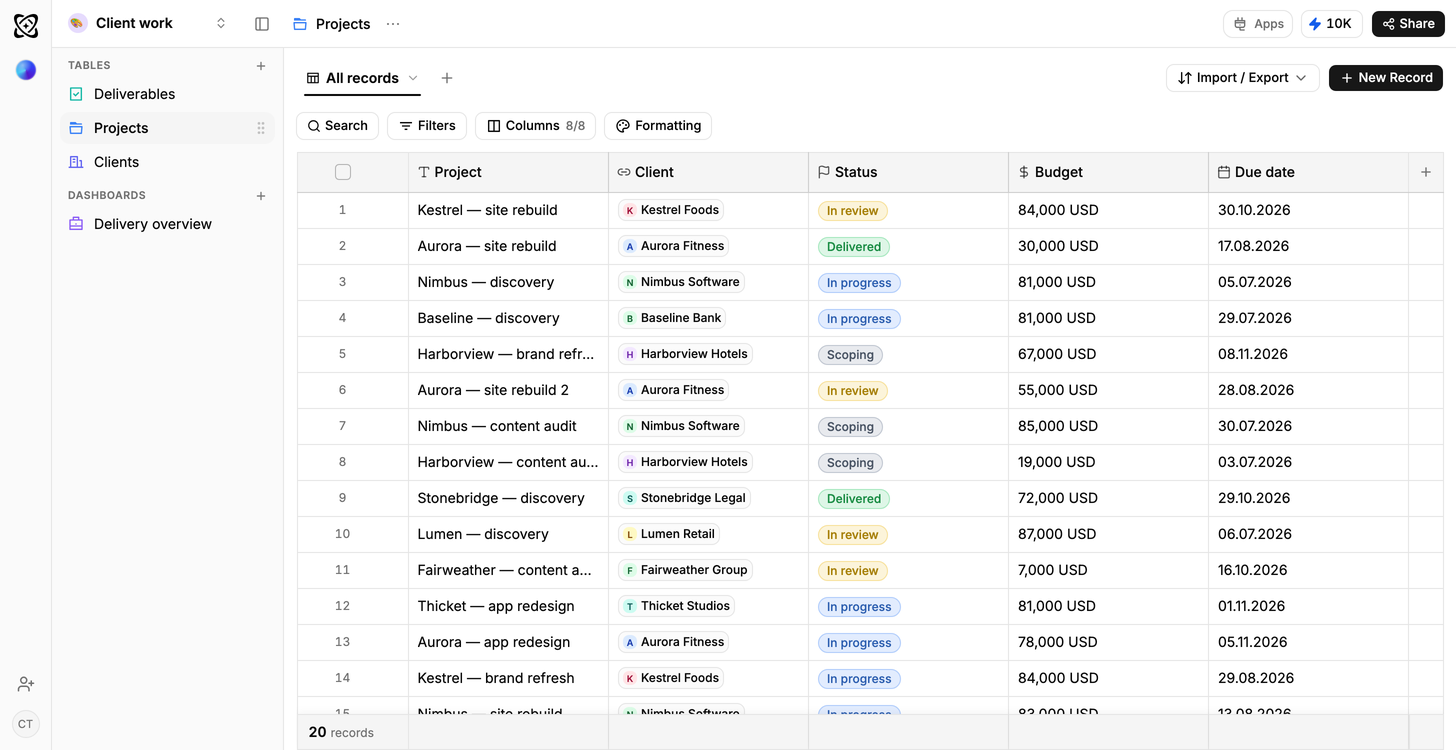
Client work
Due this week; shipped but not billed
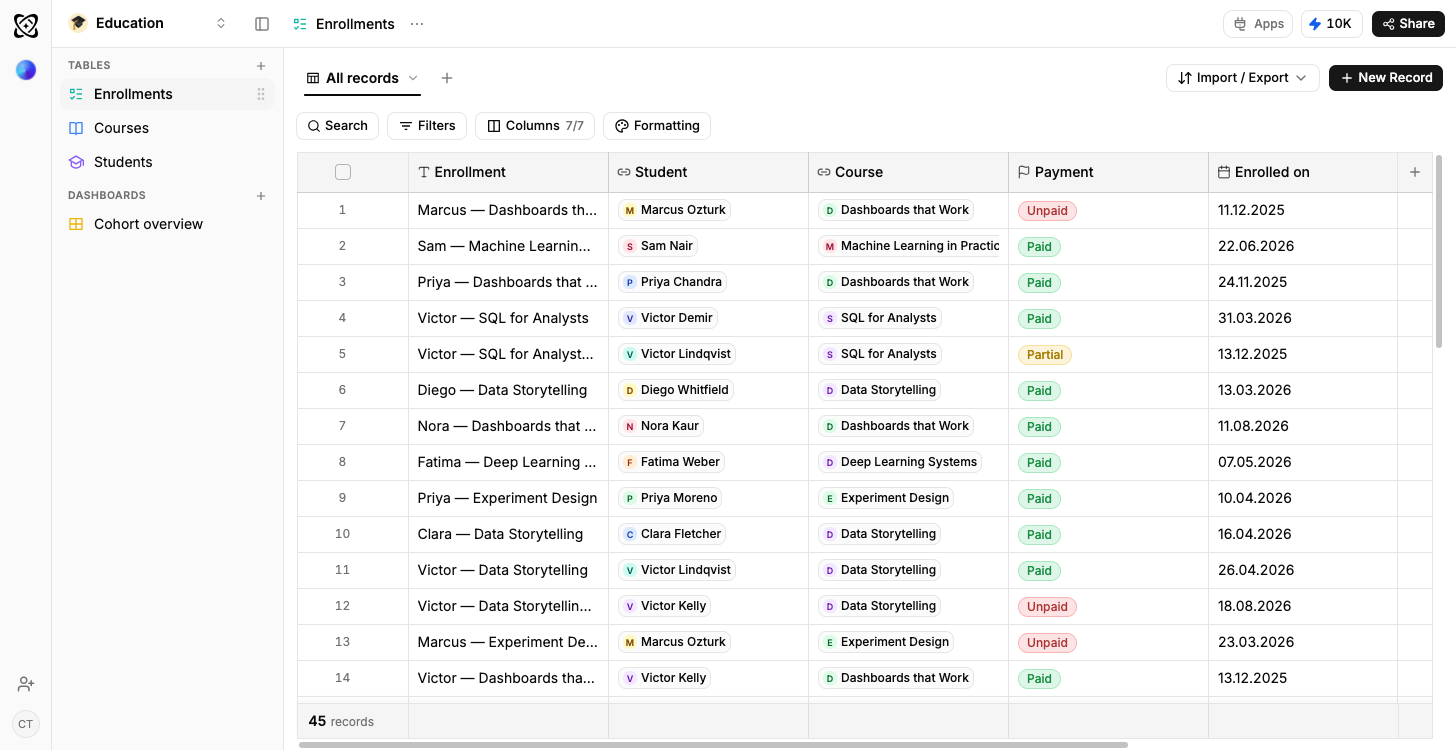
Education
Attendance and completion by cohort
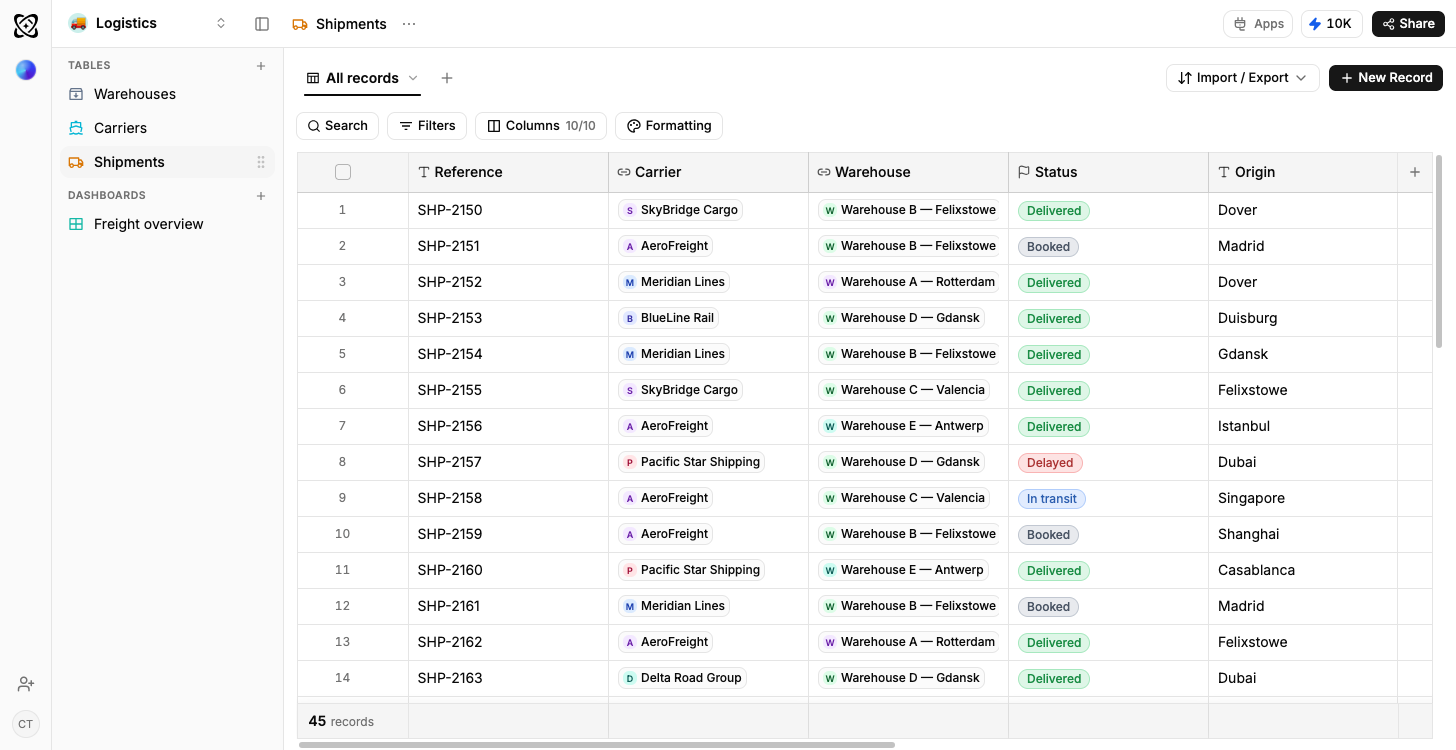
Logistics
On-time rate by carrier and lane
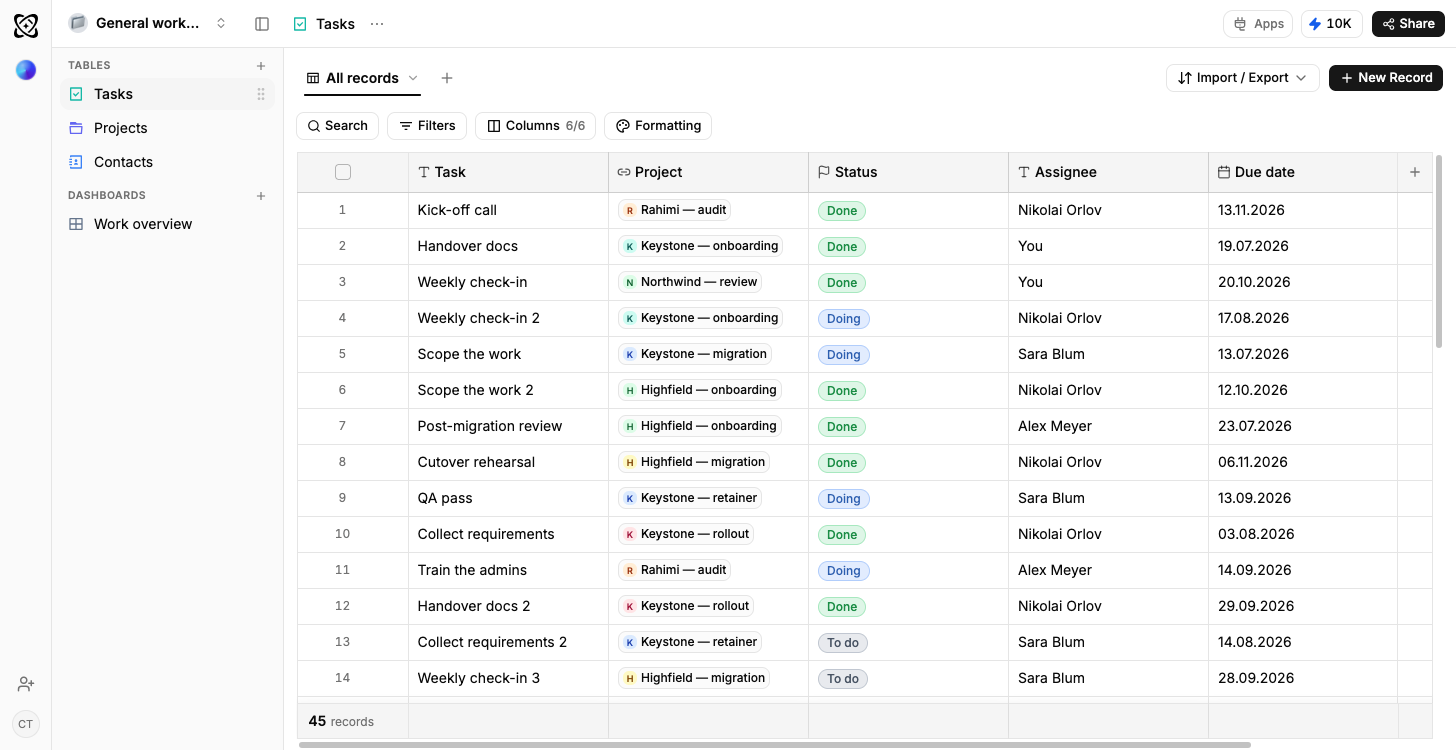
General workspace
Projects and budget by status