
How do you calculate conversion rate?
Conversion rate = (conversions / visitors) × 100
Divide conversions by visitors over the same period and multiply by 100. That's the whole formula. If 150 of 5,000 visitors took the action you care about, a purchase, a sign-up, a form fill, your conversion rate is 3%.
Benchmarks travel badly. Ecommerce sites typically convert 2–3% of visitors; lead-generation landing pages often reach 5–10%. Your own trend is the benchmark that matters, and compare paid traffic against paid, organic against organic, because a shift in traffic mix moves the number even when nothing on the page changed.
Get traffic and conversion counts into a Ferra table, a CSV import or forwarded reports, and you can ask for the rate by channel, week, or campaign in plain English, with sources attached.
How the conversion rate calculator works
Two numbers, one date range. Enter total visitors and conversions from the same analytics source and the calculator returns the rate as a percentage. A month of traffic against a week of conversions produces a number that looks right and isn't.
- Visitors
- Visitors or sessions, pick one and stay with it, for the page or site during the period, from your analytics tool. Strip internal traffic and known bots where your setup allows.
- Conversions
- Completed goal actions in the same window: purchases, form fills, whatever you defined as the goal. Count each converting visitor once unless you deliberately track repeats.
Calculating conversion rate
The math: conversions over visitors, converted to a percentage. A landing page received 8,000 visitors last month and 200 of them started a trial.
200 ÷ 8,000 = 0.025, and 0.025 × 100 = 2.5%: 25 of every 1,000 visitors converted. Run the same calculation month over month with identical definitions and you'll know whether page changes are working.
Mismatched bases produce most bad conversion rates: site-wide conversions counted against one page's traffic, or users from one report against sessions from another. Both numbers must describe the same audience over the same period, measured against a single defined goal.
What is a good conversion rate?
For ecommerce, the commonly cited average sits at 2–3%, and anything above 5% is generally considered strong. Focused landing pages with a single offer usually beat full sites, and free actions like newsletter sign-ups convert far better than purchases: compare like with like.
Context decides what the number means. A low rate usually points to a mismatch between the traffic you're buying and the offer on the page. A high rate on a trickle of visitors may be noise, so give a change enough traffic before calling it a win, and benchmark against your own history before anyone else's.
How to improve conversion rate
Better-matched traffic in, less friction between landing and converting: every lever below pulls on one side or the other.
- Match the page to the ad
- Carry the same headline, offer, and imagery from ad to landing page. Visitors who see what they clicked for stay; a mismatch sends them straight back.
- Cut form fields
- Every field you remove lifts completion. Ask only for what you need to follow up and collect the rest later.
- Make the page fast
- Slow pages bleed visitors before the offer ever renders. Compress images, cut scripts, and test on a mid-range phone, not your office connection.
- Put proof next to the button
- Reviews, customer counts, and trust badges beside the CTA reduce hesitation at the exact moment of decision.
- Qualify traffic upstream
- Tighter keywords and audiences keep low-intent visitors from landing at all. A smaller, better-matched audience raises the rate even if total conversions stay flat.
- Test one change at a time
- A/B test headlines, then CTAs, then layout: one variable at a time tells you what actually moved the number instead of leaving you guessing.
Other calculators
Browse all calculatorsRelated templates
Browse all templates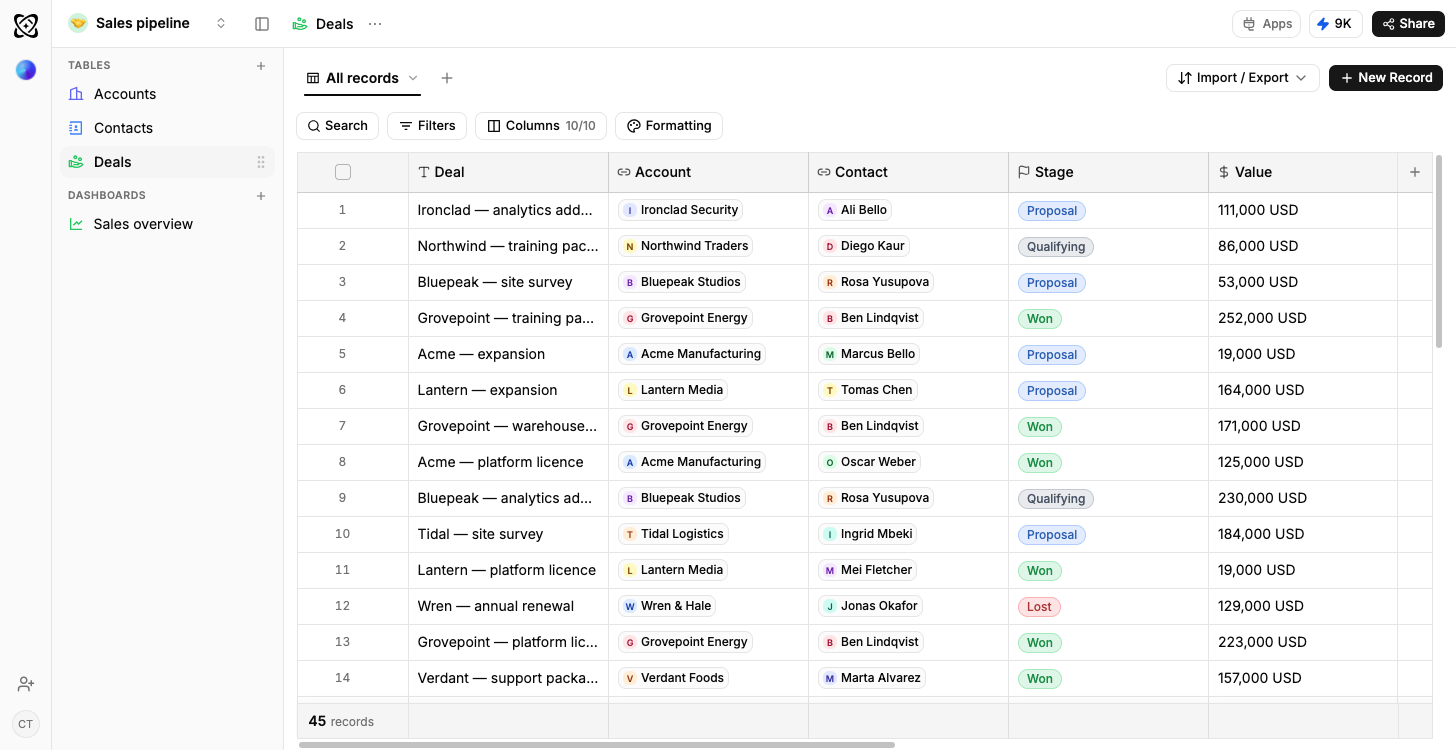
Sales pipeline
Open pipeline by stage, results by owner
- TikTok
- YouTube
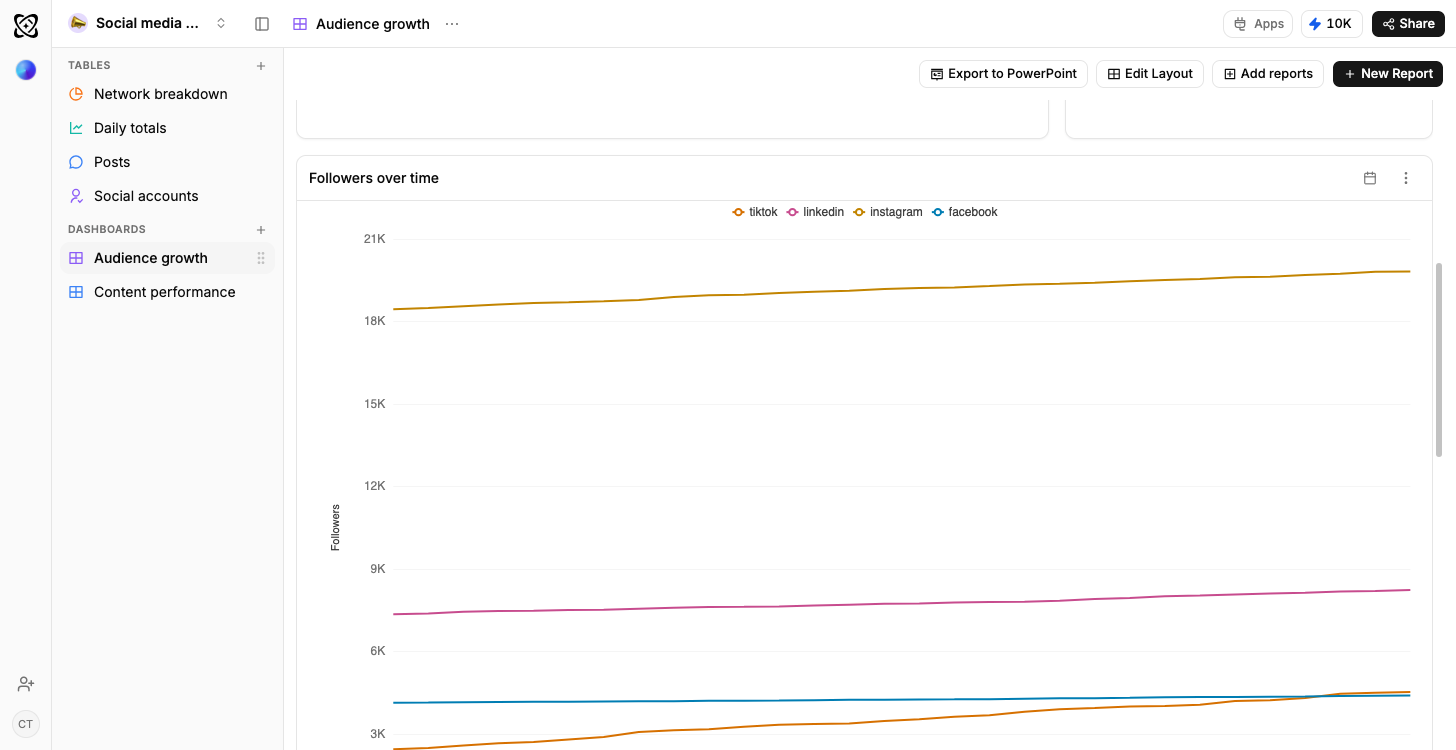
Social media analytics
Every channel compared, and what works where
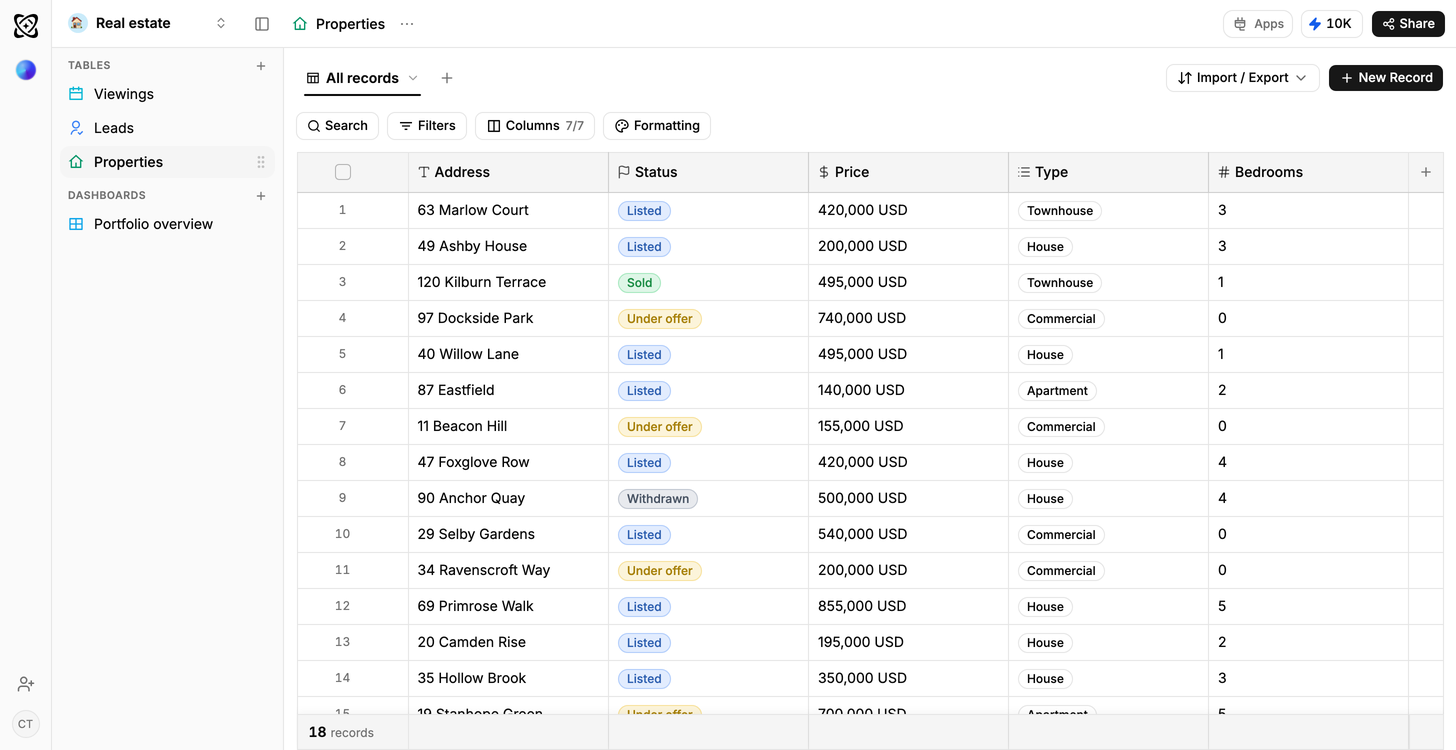
Real estate
Portfolio value and leads, by stage
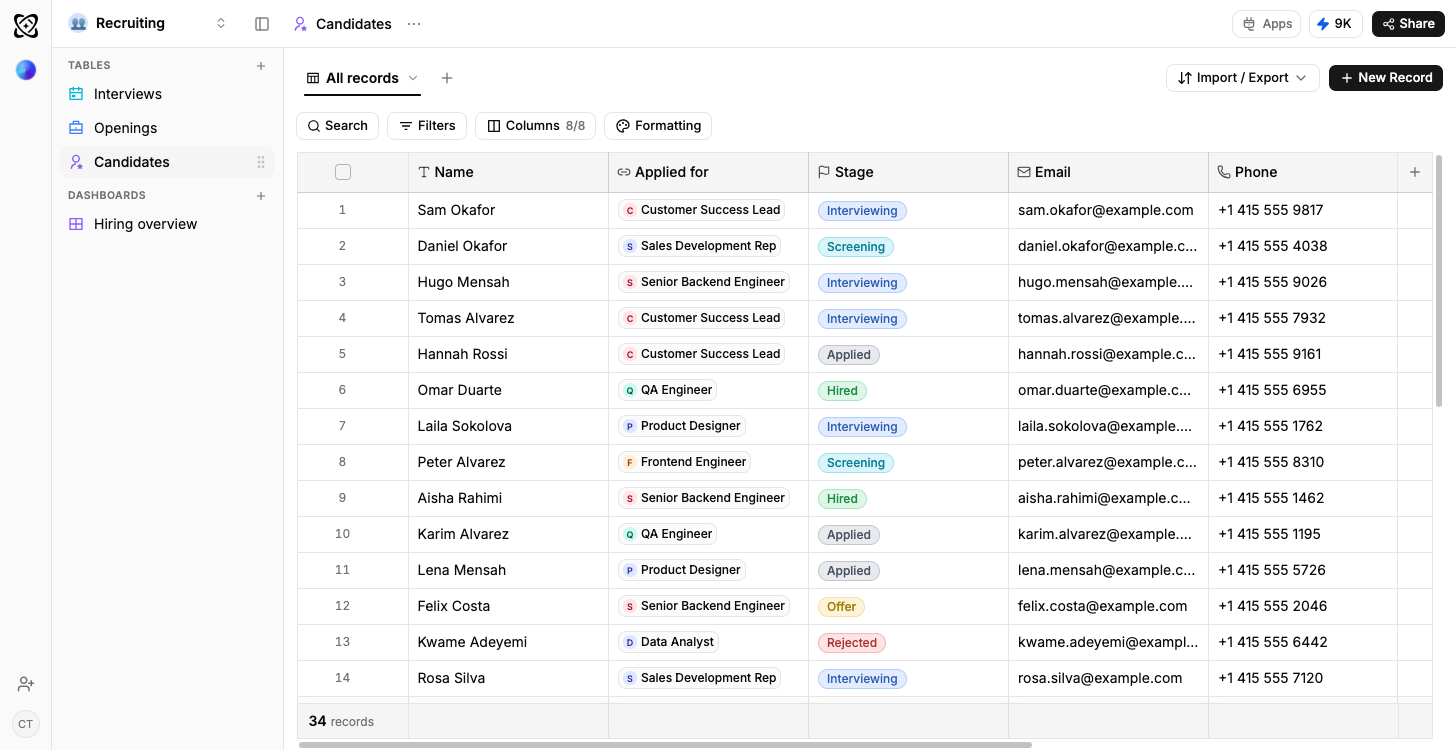
Recruiting
Candidates by stage, openings by status
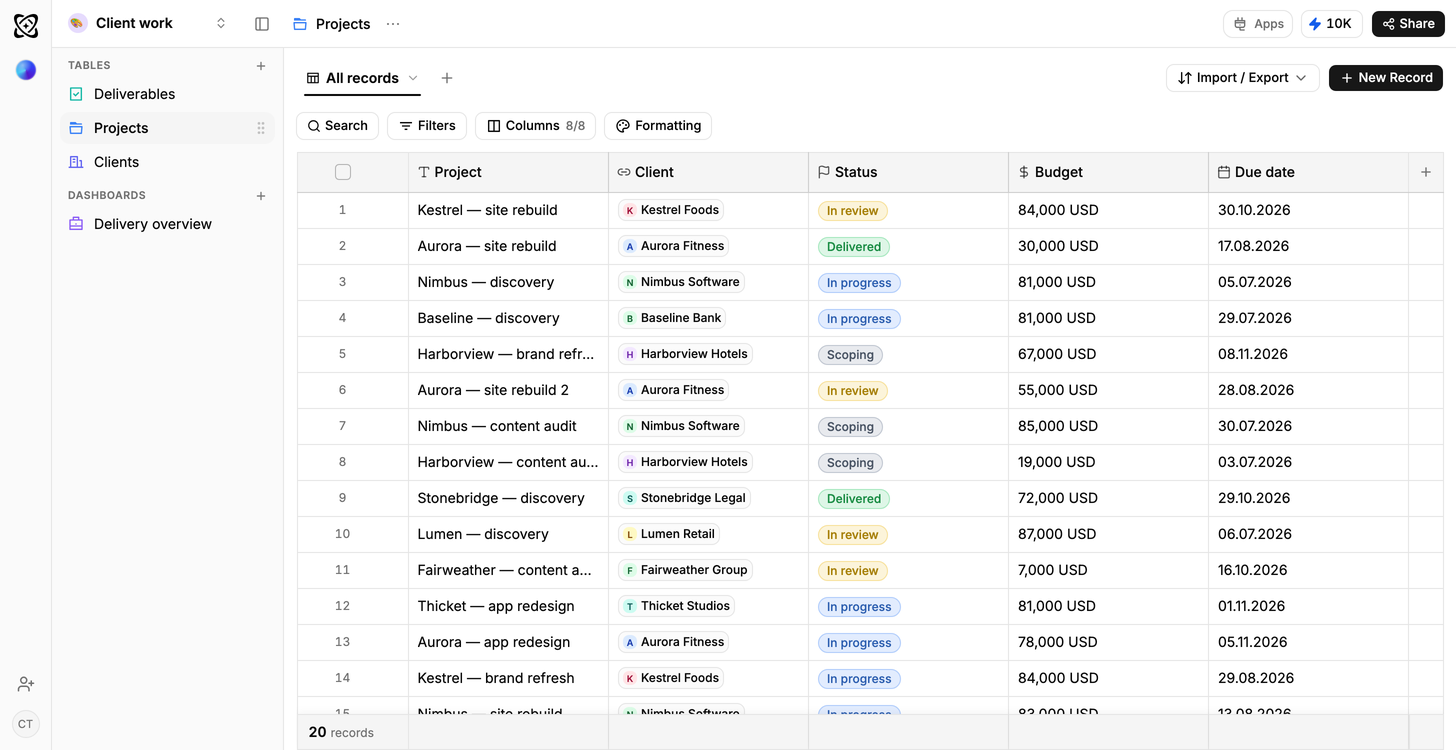
Client work
Due this week; shipped but not billed
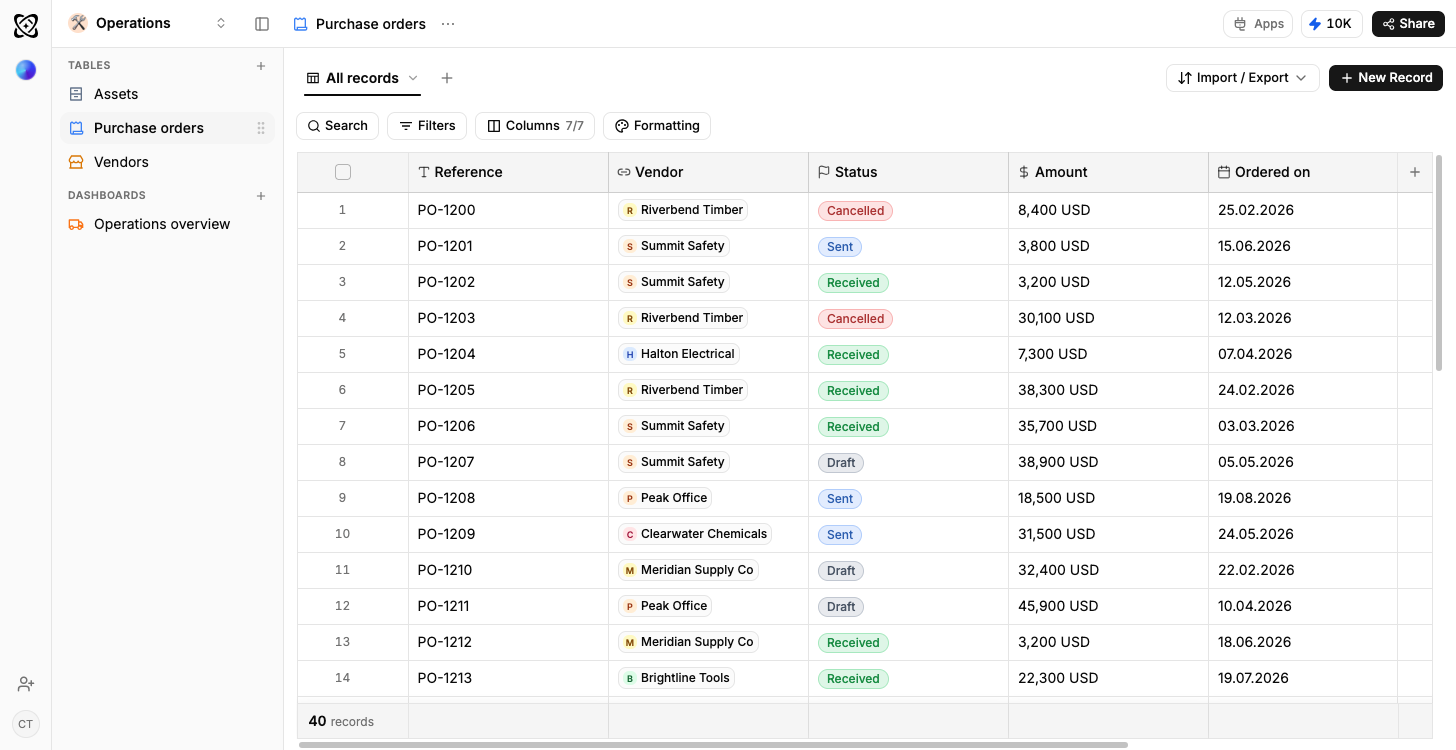
Operations
Orders in flight, spend by supplier
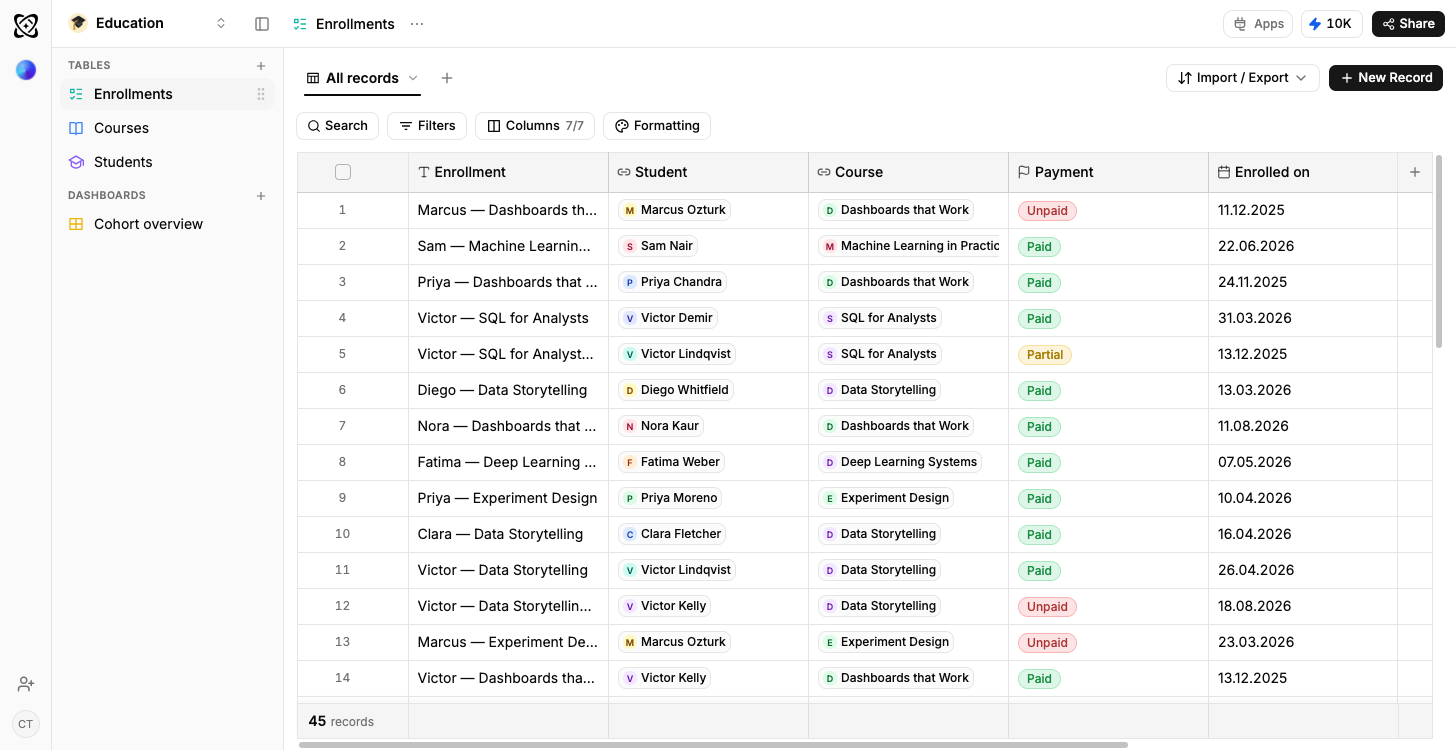
Education
Attendance and completion by cohort
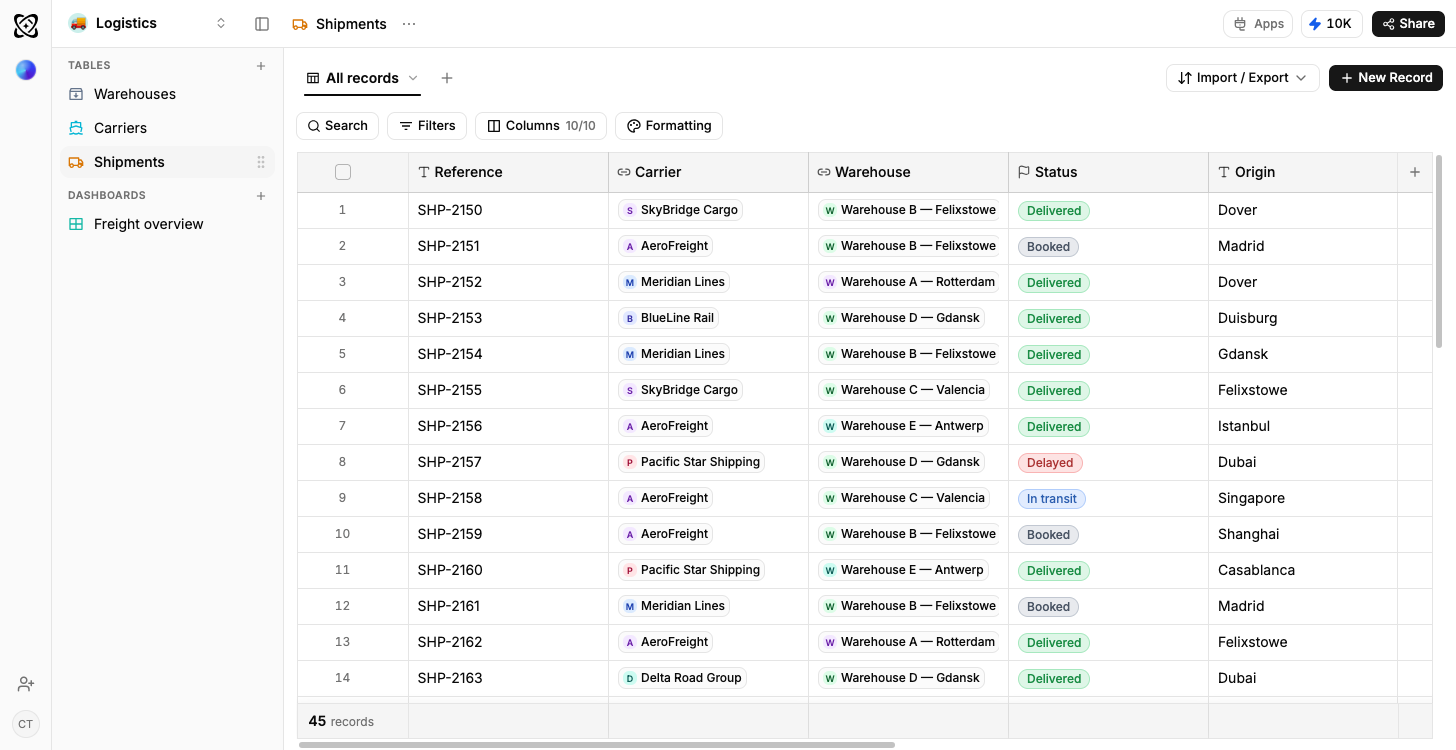
Logistics
On-time rate by carrier and lane