
How is ROAS calculated?
ROAS = attributed revenue / ad spend
ROAS is one division: the revenue your tracking attributes to a campaign, over what you spent on it. Spend $2,000, drive $8,000 in tracked revenue, and your ROAS is 4: written 4:1 or 400%, all the same number.
A 4:1 ROAS is a common ecommerce target, but the return you actually need is set by your margins: a business with 30% gross margin needs a far higher ROAS to break even than one at 70%. ROAS counts revenue, not profit. It also lives on attribution: the same campaign can show very different returns in the ad platform and in your own analytics, so pick one source of truth and stay with it.
Hold spend and attributed revenue per campaign in a Ferra table and you can ask which campaigns clear your target ROAS without exporting anything.
How the ROAS calculator works
Keep it to one campaign and one period. Enter spend and attributed revenue; the calculator returns ROAS as both a ratio and a percentage.
- Ad spend
- The media cost the platform billed for this campaign over the period. Some teams fold in agency fees and creative costs too, fine, as long as every campaign you compare gets the same rule.
- Attributed revenue
- The revenue conversion tracking credits to the campaign, from the platform's pixel or your analytics attribution model. Use the same attribution window and model every time, or campaigns stop being comparable.
Calculating ROAS
Attributed revenue divided by ad spend, the whole formula. Suppose you spent $5,000 on a campaign and your tracking credits it with $15,000 in revenue.
15,000 ÷ 5,000 = 3, so ROAS is 3: usually written 3:1 or 300%. Every ad dollar brought back three dollars of tracked revenue.
ROAS is not ROI, and confusing them costs money. ROAS uses revenue, not profit: a 2:1 ROAS on a product with a 40% gross margin loses money, because $2 of revenue carries only $0.80 of gross profit against $1 of spend. Know your margin before you decide what ROAS you need.
What is a good ROAS?
Start from break-even, not folklore. Your floor is roughly 1 divided by gross margin: at a 50% margin you need at least 2:1 just to cover the ad cost, while at a 25% margin the break-even is 4:1. The often-quoted 4:1 target only means something once you know where your floor sits.
Extremes carry information. A very high ROAS often means the campaign is skimming easy demand, branded search, retargeting, and could profitably scale further. A low one points to weak targeting, an offer or landing page that isn't converting, or an attribution model crediting the campaign for sales it didn't cause.
How to improve ROAS
Spend the same money on people more likely to buy, or earn more from each buyer. Every lever below hits one side of the ratio.
- Cut the losers fast
- Review ad sets and keywords weekly and pause anything well below your break-even ROAS. Reallocating that budget to winners lifts the blended number immediately.
- Tighten who sees the ads
- Negative keywords and prospecting exclusions for already-converted customers cut wasted spend; so does narrowing audiences that convert poorly.
- Fix the landing page before blaming the ads
- The same clicks converting at a higher rate raises revenue with zero extra spend.
- Raise order value
- Bundles, upsells, and free-shipping thresholds increase revenue per conversion, which flows straight into ROAS without touching the ad account.
- Refresh creative before it fatigues
- Ad fatigue quietly raises costs as engagement drops. New creative restores click-through rates and keeps auction prices down.
Other calculators
Browse all calculatorsRelated templates
Browse all templates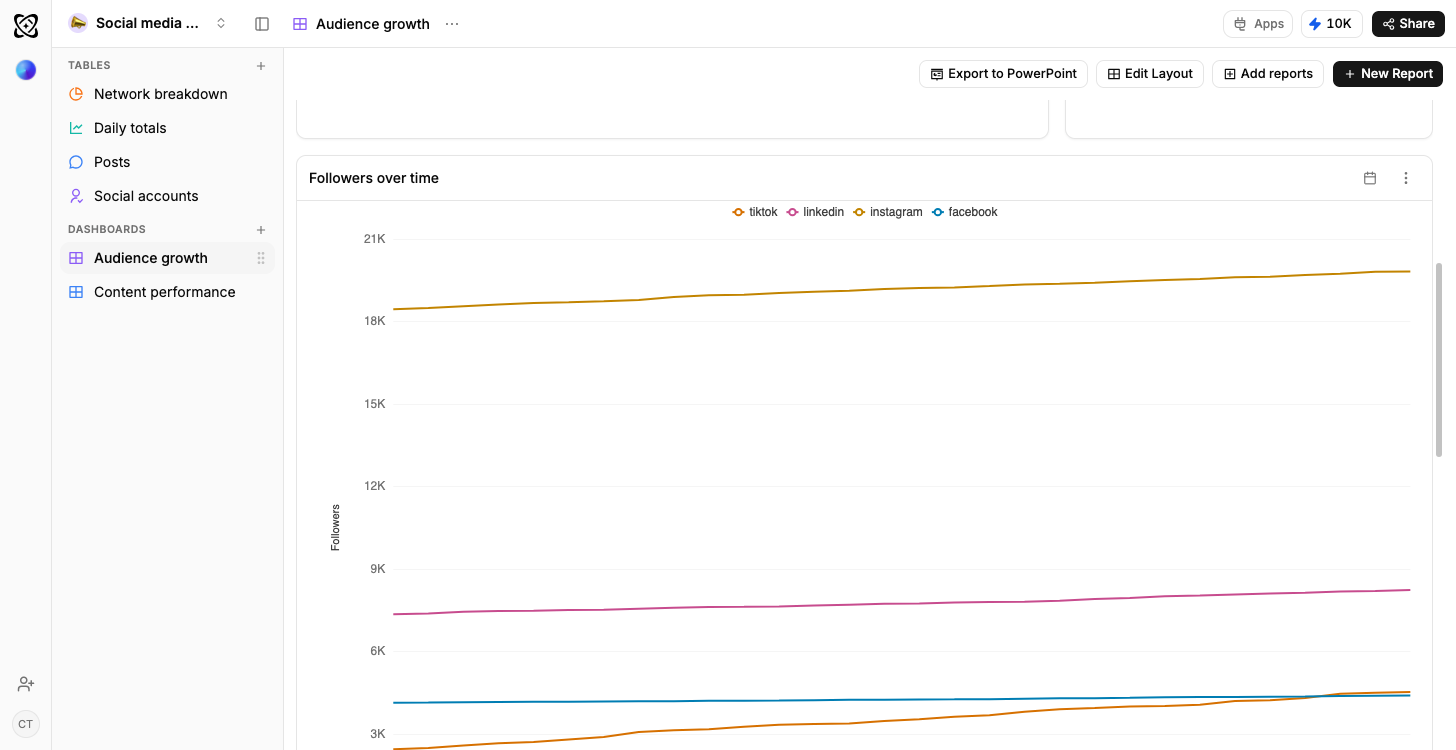
- TikTok
- YouTube
Social media analytics
Every channel compared, and what works where
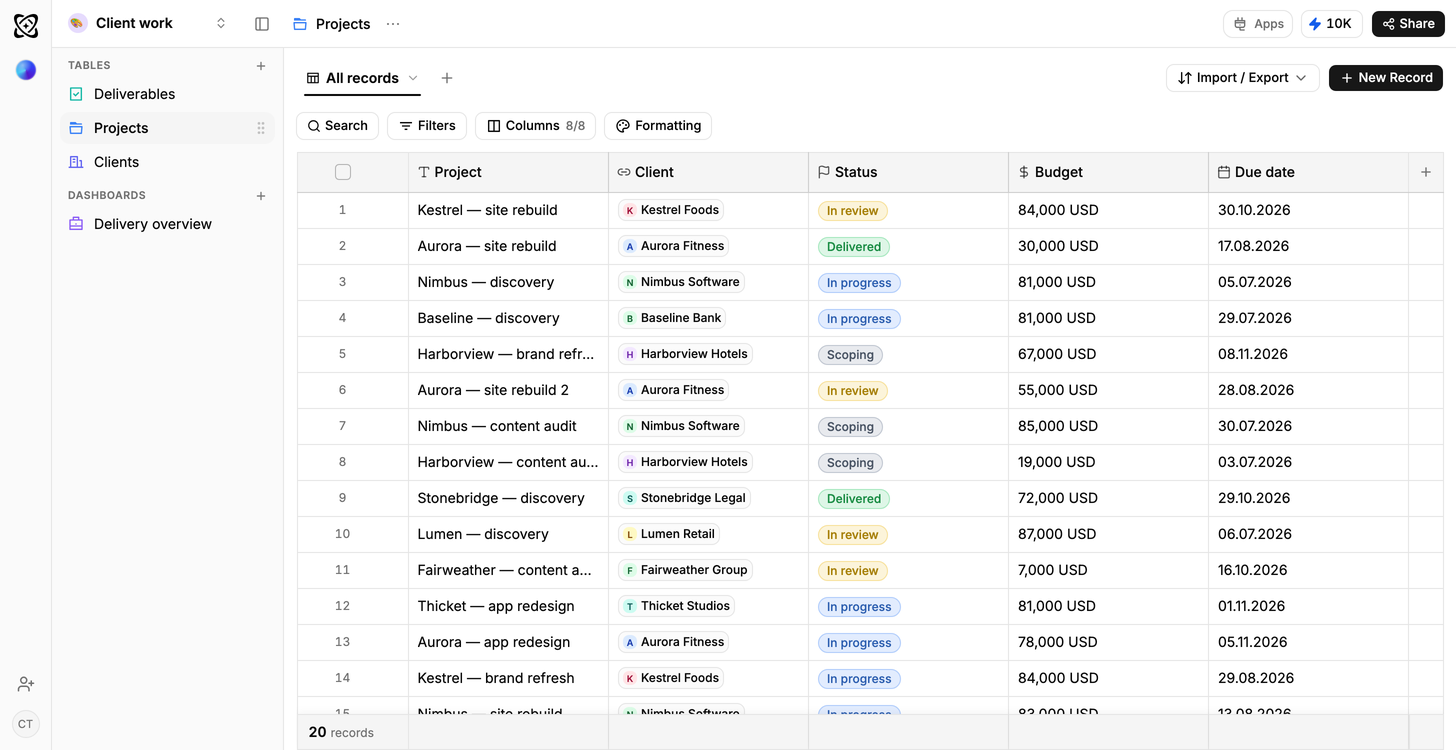
Client work
Due this week; shipped but not billed
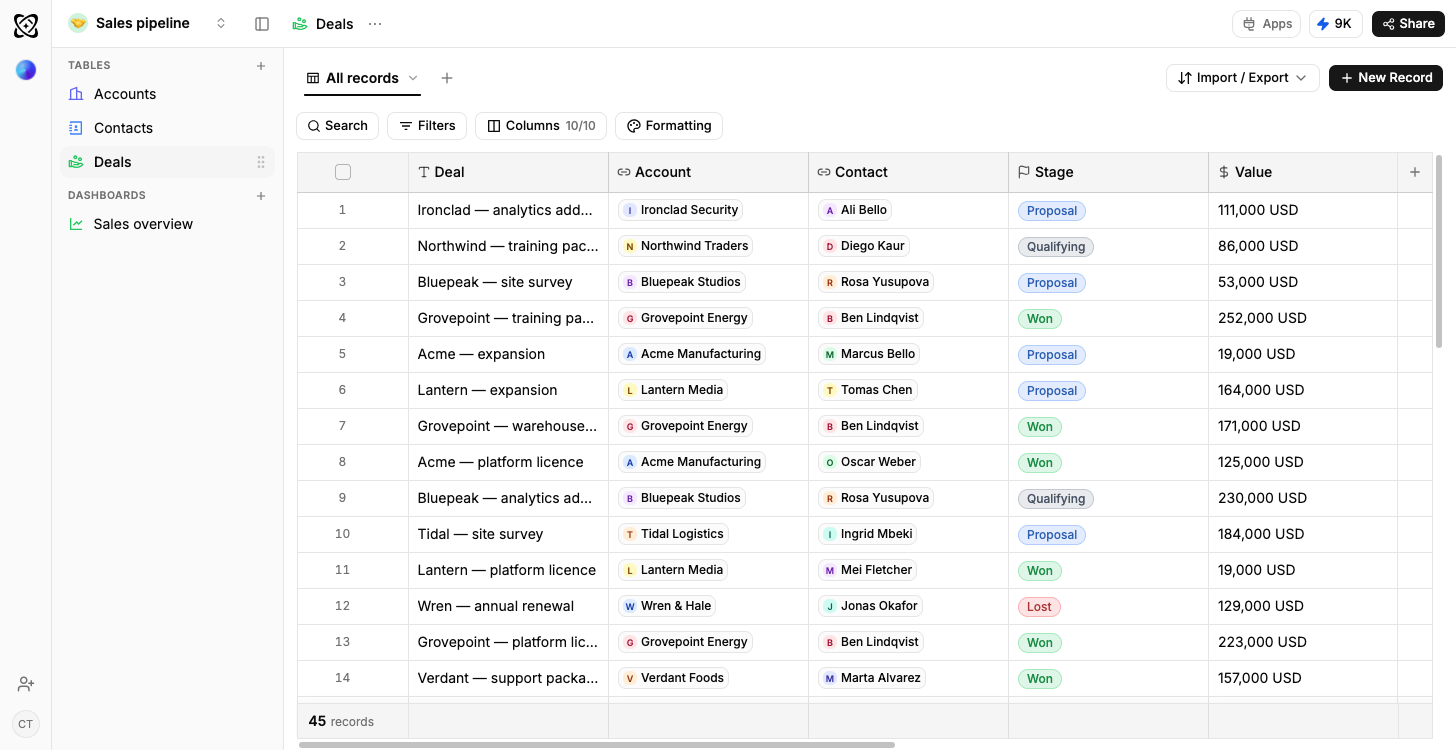
Sales pipeline
Open pipeline by stage, results by owner
Real estate
Portfolio value and leads, by stage
Recruiting
Candidates by stage, openings by status
Operations
Orders in flight, spend by supplier
Education
Attendance and completion by cohort