
How is CAGR calculated?
CAGR = ((ending value / beginning value)^(1 / years) − 1) × 100
CAGR, compound annual growth rate, answers one question: what steady yearly rate turns the value you started with into the value you ended with? The arithmetic: divide the ending value by the beginning value, raise the result to the power of one over the number of years, subtract one, and multiply by 100. Every bumpy in-between year gets smoothed into that single rate.
The smoothing is the point. CAGR puts unlike things, a revenue line against an investment, one market against another, on the same annual footing regardless of time span. It also hides volatility completely: a business that grew 50%, shrank 20%, and grew 40% shows the same CAGR as one that climbed steadily. For scale, mature public companies often grow revenue at single-digit CAGRs, while early-stage companies are expected to run well above that.
Keep monthly or yearly figures in a Ferra table and you can ask for any column's CAGR in plain English, the answer arrives with the rows it came from.
How the CAGR calculator works
Start value, end value, years between. From those three the calculator returns a single number: the constant annual rate that would carry the first value to the second.
- Beginning value
- The value on the start date: opening revenue, a portfolio balance, a user count, any measure you track. The figure as of that date, not an average of the first year.
- Ending value
- The end-of-period value, measured exactly the way the beginning was. Gross revenue at the start against net at the end produces a meaningless rate.
- Number of years
- Elapsed time between the two measurements, intervals, not data points. Five annual figures span four years. Fractional years like 2.5 work fine.
Calculating CAGR
Revenue grows from $100,000 to $133,100 over three years. Divide: 133,100 ÷ 100,000 = 1.331. Raise to the one-third power: 1.331^(1/3) = 1.10. Subtract one, multiply by 100. CAGR is 10%.
Run it forward to check: $100,000 growing 10% a year hits $110,000, then $121,000, then $133,100. The real path was almost certainly lumpier. CAGR ignores the lumps on purpose and reports the one steady rate that lands at the same endpoint.
Count the years wrong and everything downstream is wrong. Growth from 2020 to 2023 is three years of growth despite involving four annual figures, enter 4 and the rate comes out too low. Averaging the individual yearly growth rates fails in the other direction: a simple average ignores compounding and overstates growth.
What is a good CAGR?
Broad stock market indexes have historically returned around 7–10% a year over long horizons, so an investment compounding above that is beating the market. For companies it depends on age: mature ones often grow revenue in the single digits, while early-stage companies are expected to grow much faster, sometimes doubling in their first years, with the rate tapering as the base gets bigger.
Always read CAGR next to its time span. A high rate over two years says far less than the same rate held for ten, and the metric hides volatility completely: a lurching path and a smooth one to the same endpoint produce identical rates. When options compete, look under the headline at the yearly numbers.
How to improve CAGR
CAGR rewards repetition, a lever that works every year beats a one-time win. Small durable improvements to the annual rate stack dramatically over a full period.
- Reduce churn
- Kept revenue compounds; replaced revenue doesn't. Less churn means a bigger base for every following year to grow from.
- Build recurring revenue
- Subscriptions and repeat purchases turn this year's wins into next year's starting point, exactly what a compounding rate pays for.
- Raise prices steadily
- A small annual increase across the customer base compounds like interest: 3% a year works out to roughly a 16% cumulative increase over five years.
- Reinvest in channels that scale
- Growth funded from cash flow keeps compounding. A channel that saturates fast delivers one good year, then drags the rate down.
- Expand into adjacent markets
- New segments, geographies, and products extend the runway. The hardest part of sustaining a CAGR is holding the rate as the base gets large.
Other calculators
Browse all calculatorsRelated templates
Browse all templates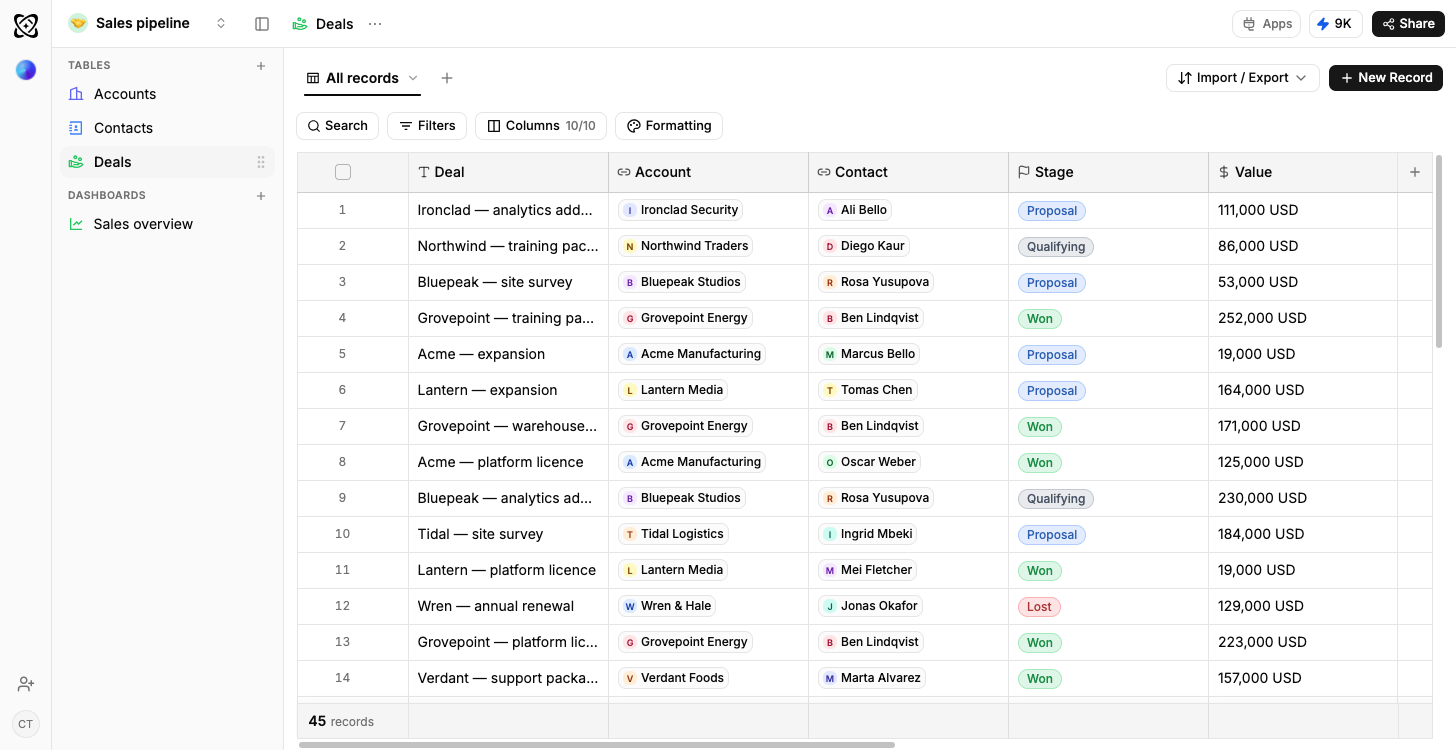
Sales pipeline
Open pipeline by stage, results by owner
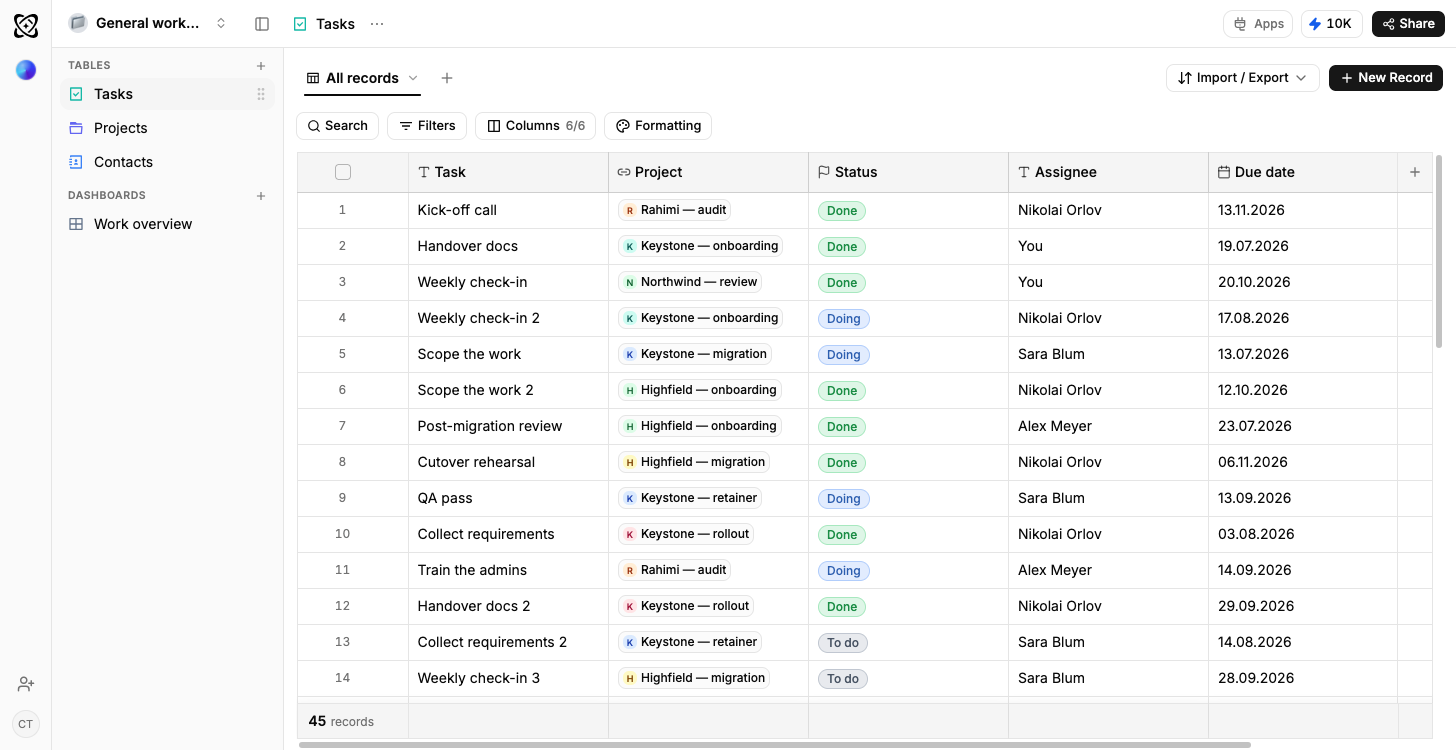
General workspace
Projects and budget by status
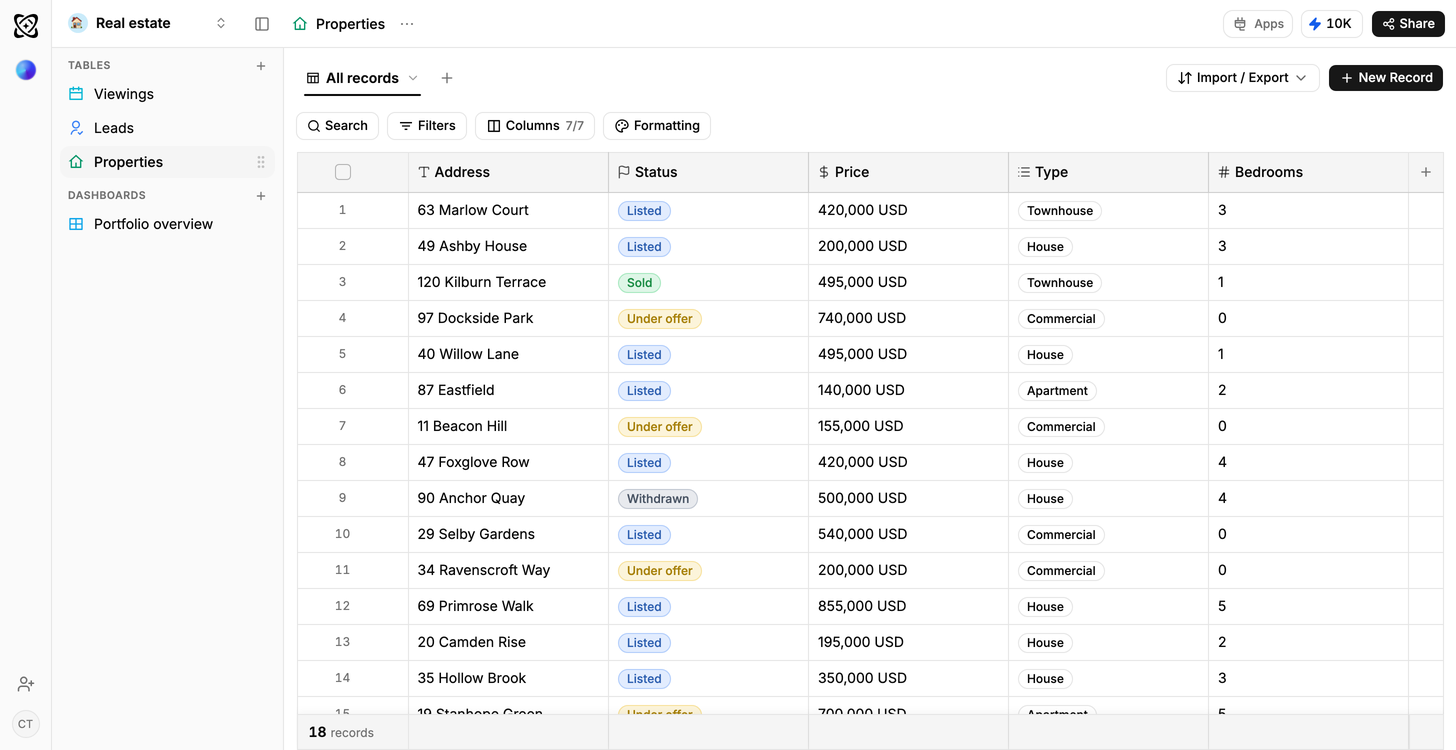
Real estate
Portfolio value and leads, by stage
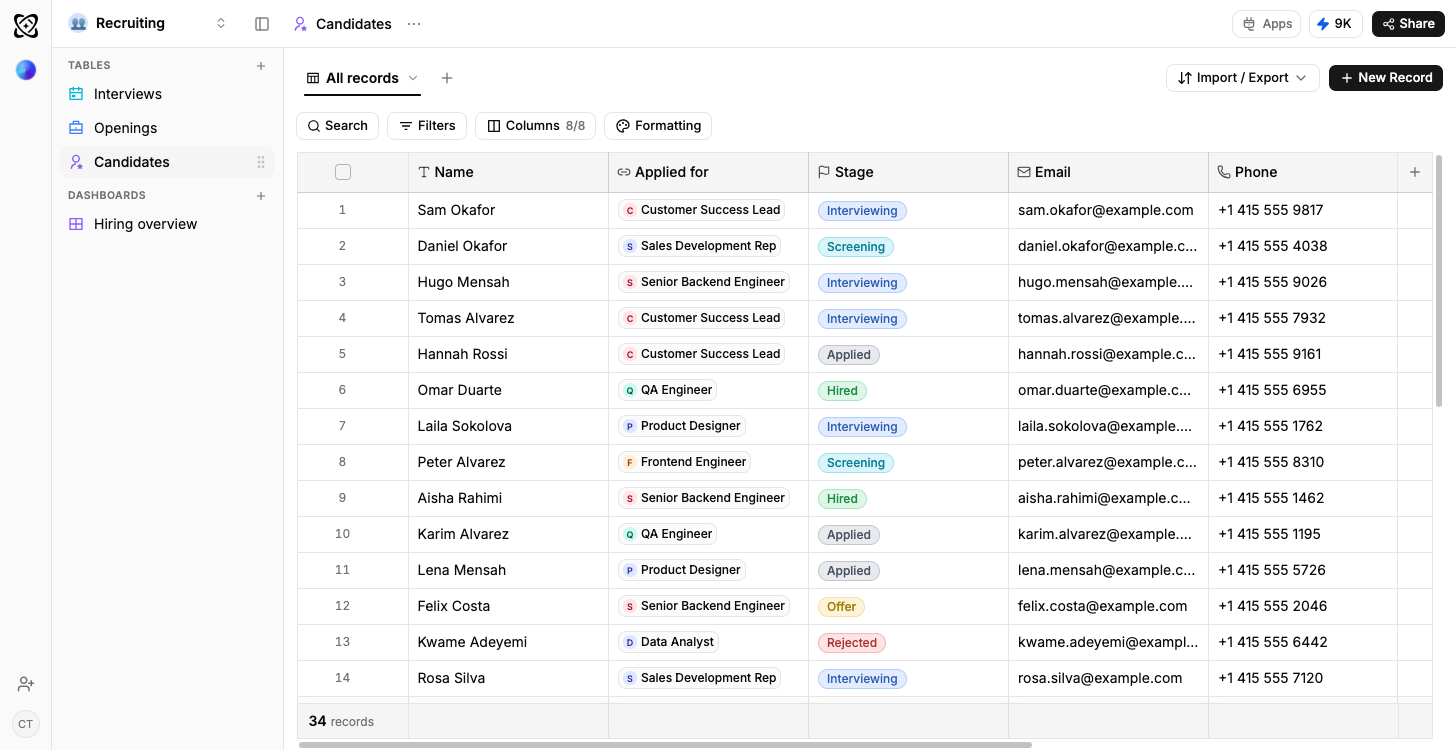
Recruiting
Candidates by stage, openings by status
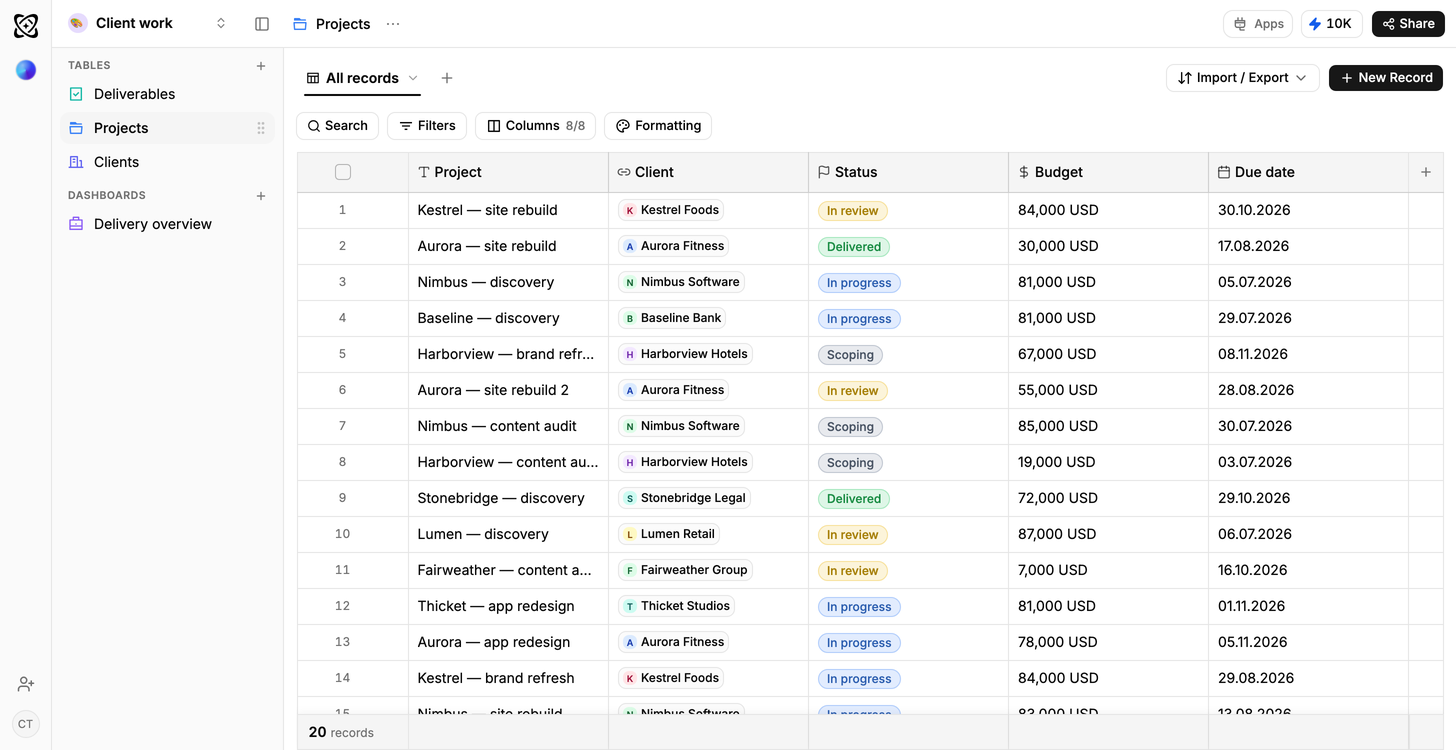
Client work
Due this week; shipped but not billed
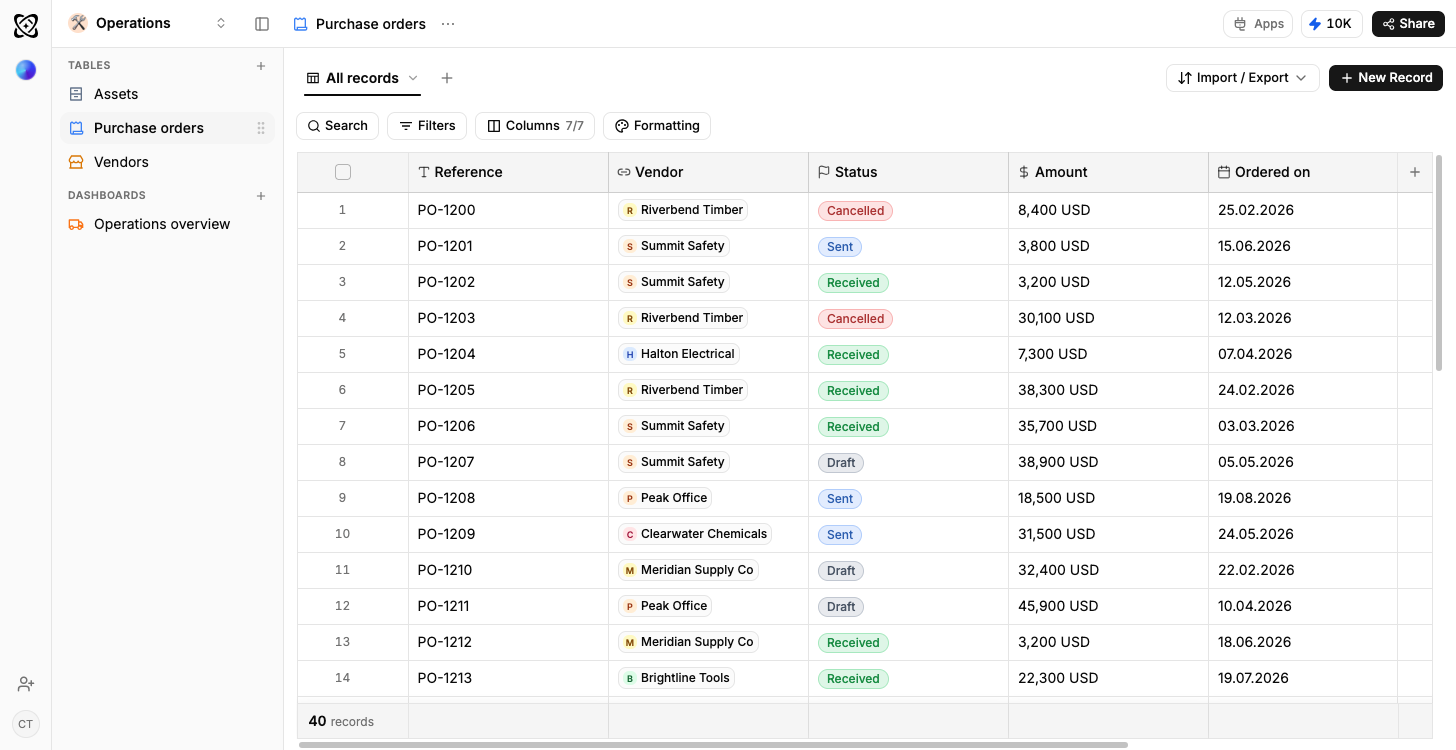
Operations
Orders in flight, spend by supplier
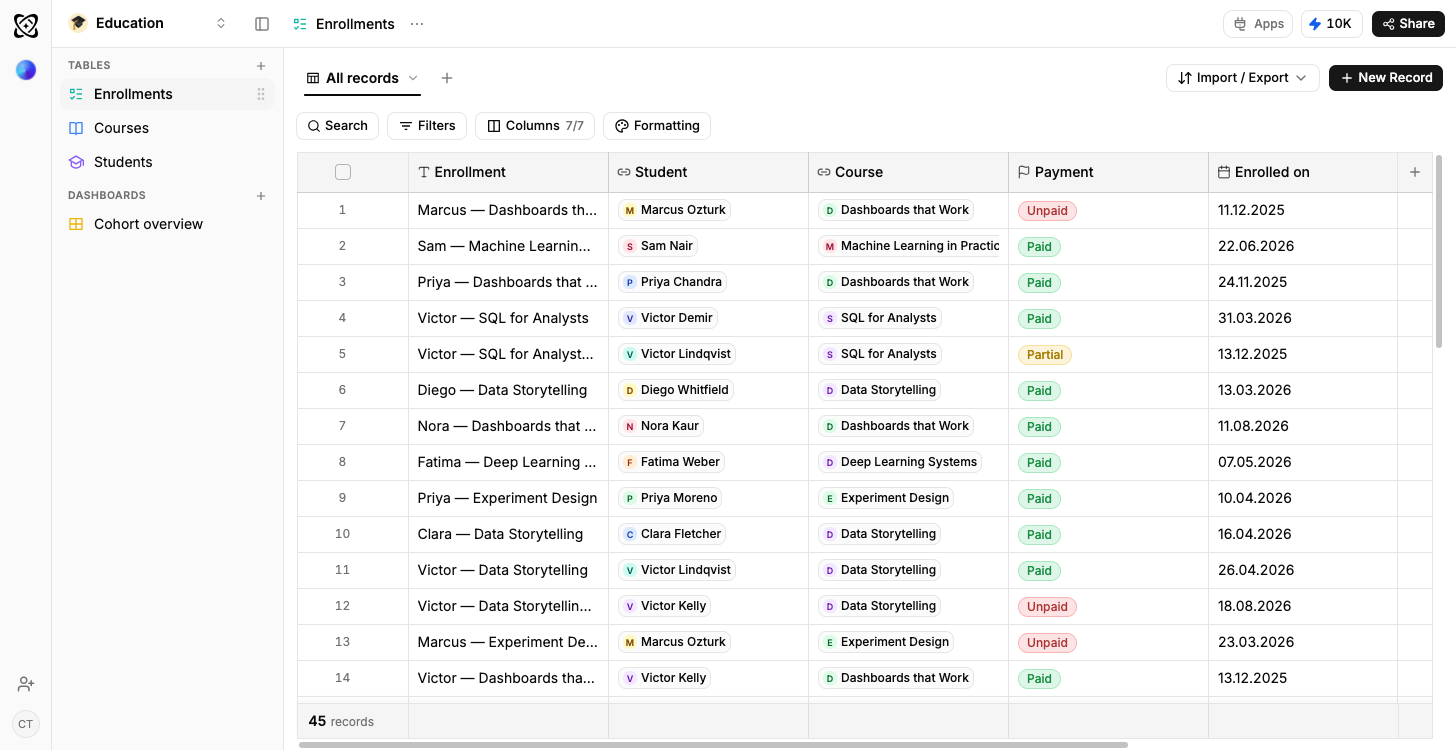
Education
Attendance and completion by cohort
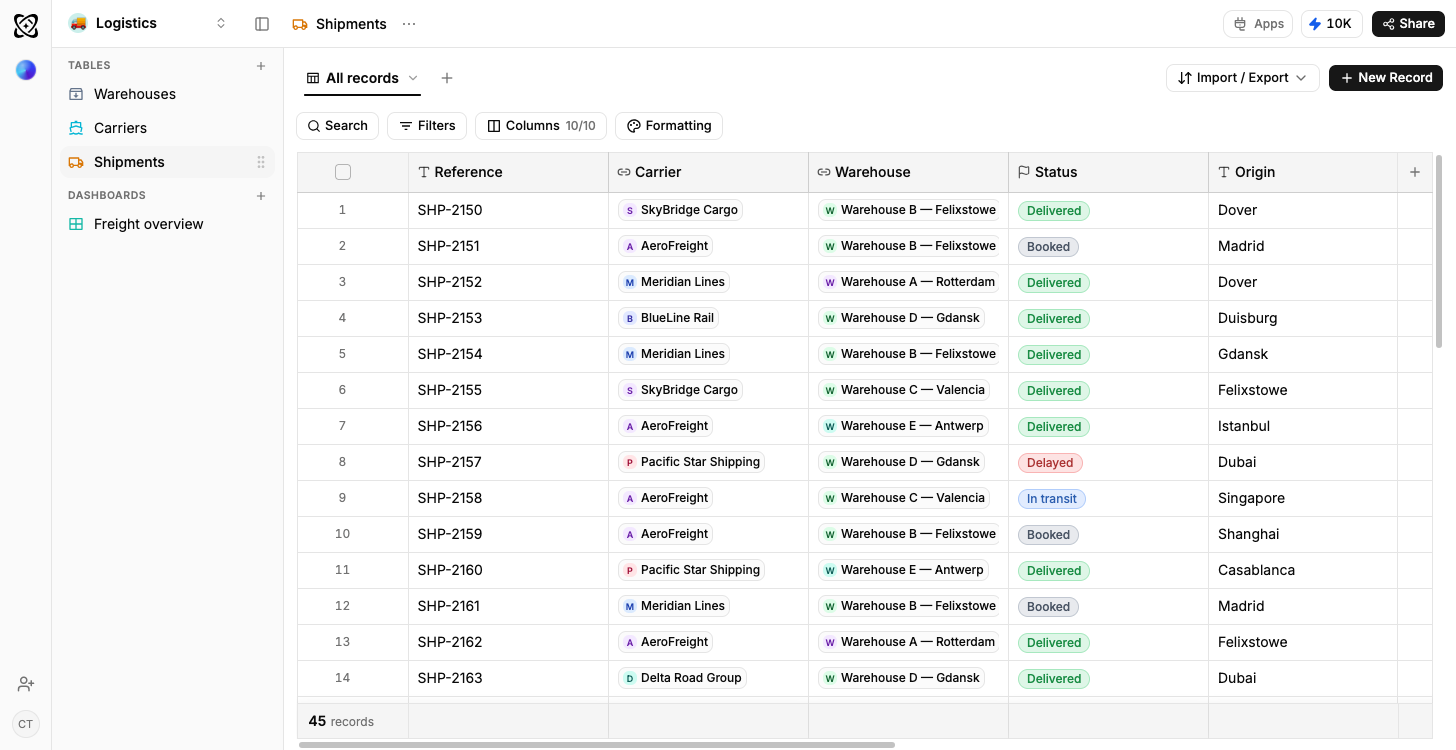
Logistics
On-time rate by carrier and lane