
How is the SaaS magic number calculated?
magic number = (current quarter revenue − prior quarter revenue) × 4 / prior quarter sales & marketing spend
Take this quarter's revenue, subtract last quarter's, multiply the difference by 4, and divide by last quarter's sales and marketing spend. That's the magic number: annualized recurring revenue per dollar of go-to-market spend. The spend is lagged a quarter on purpose: last quarter's money is what closed this quarter's deals.
Above 0.75, the engine is efficient; keep feeding it. Between 0.5 and 0.75, find what's dragging before you add budget. Below 0.5, fix the go-to-market motion before you scale it, and a number well above 1 cuts the other way, hinting you're underinvesting in growth. The metric is blind to gross margin and churn, so check it against CAC payback period before you move budget.
Keep quarterly revenue and spend in a Ferra table and the magic number is one plain-English question away each quarter.
How the SaaS magic number calculator works
The calculator asks for two quarters of revenue and one quarter of spend. It multiplies the quarter-over-quarter revenue gain by 4 to annualize it, divides by the spend, and shows what each sales and marketing dollar produced.
- Current quarter revenue
- Recurring revenue for the most recent complete quarter. Pick one definition, GAAP subscription revenue or quarterly run rate, and never switch between them.
- Prior quarter revenue
- The same figure, one quarter back. The gap between the two quarters is the growth your earlier spend bought.
- Prior quarter sales & marketing spend
- All of it: salaries, commissions, ad budgets, tools, events. The prior quarter is what counts, because that money drove this quarter's revenue.
Calculating the SaaS magic number
Current quarter revenue minus prior quarter revenue, times 4, divided by prior quarter sales and marketing spend. The one-quarter lag is the whole point of the formula: pipeline built with last quarter's budget takes roughly a quarter to close.
Say revenue grew from $1,000,000 last quarter to $1,100,000 this quarter, and last quarter's sales and marketing spend was $500,000. The quarterly increase is $100,000; annualized, that's $100,000 × 4 = $400,000. Magic number: $400,000 / $500,000 = 0.8: each spend dollar generated 80 cents of annualized recurring revenue.
Watch for two errors. Dividing by the current quarter's spend instead of the prior quarter's flatters companies that are ramping spend fast. And if you measure the change in ARR, already an annual figure, don't multiply by 4 again; the ×4 belongs only on quarterly recognized revenue.
What is a good SaaS magic number?
Above 1.0, every sales and marketing dollar pays for itself in annualized revenue within a year: the standard signal to invest more aggressively. Above 0.75, the motion is efficient enough to justify more investment. Between 0.5 and 0.75 is a caution zone. Below 0.5, the sales motion is losing money, and scaling it scales the loss.
A very high reading deserves suspicion before celebration: past 1.5, you may be under-investing and leaving demand on the table. And because the formula uses the net change in revenue, heavy churn drags the number down even while new sales stay strong: a falling magic number is sometimes a retention problem, not a sales problem.
How to improve the SaaS magic number
The number rises when the same spend produces more net new revenue, so work the conversion path before you work the budget.
- Narrow the ideal customer profile
- Segments that close faster and stay longer return more revenue per dollar than broad targeting ever will.
- Raise conversion before raising spend
- A higher win rate or trial-to-paid rate grows the revenue delta without adding a dollar to the denominator.
- Compress the sales cycle
- A deal that closes a quarter sooner lands its revenue inside the measured window instead of drifting past it.
- Sell more to existing customers
- Upsell revenue counts in the quarter-over-quarter delta and costs far less to win than a new logo.
- Cut churn
- The formula runs on net revenue change, so every churned dollar cancels a dollar of new sales. Retention work shows up directly in the number.
Other calculators
Browse all calculatorsRelated templates
Browse all templates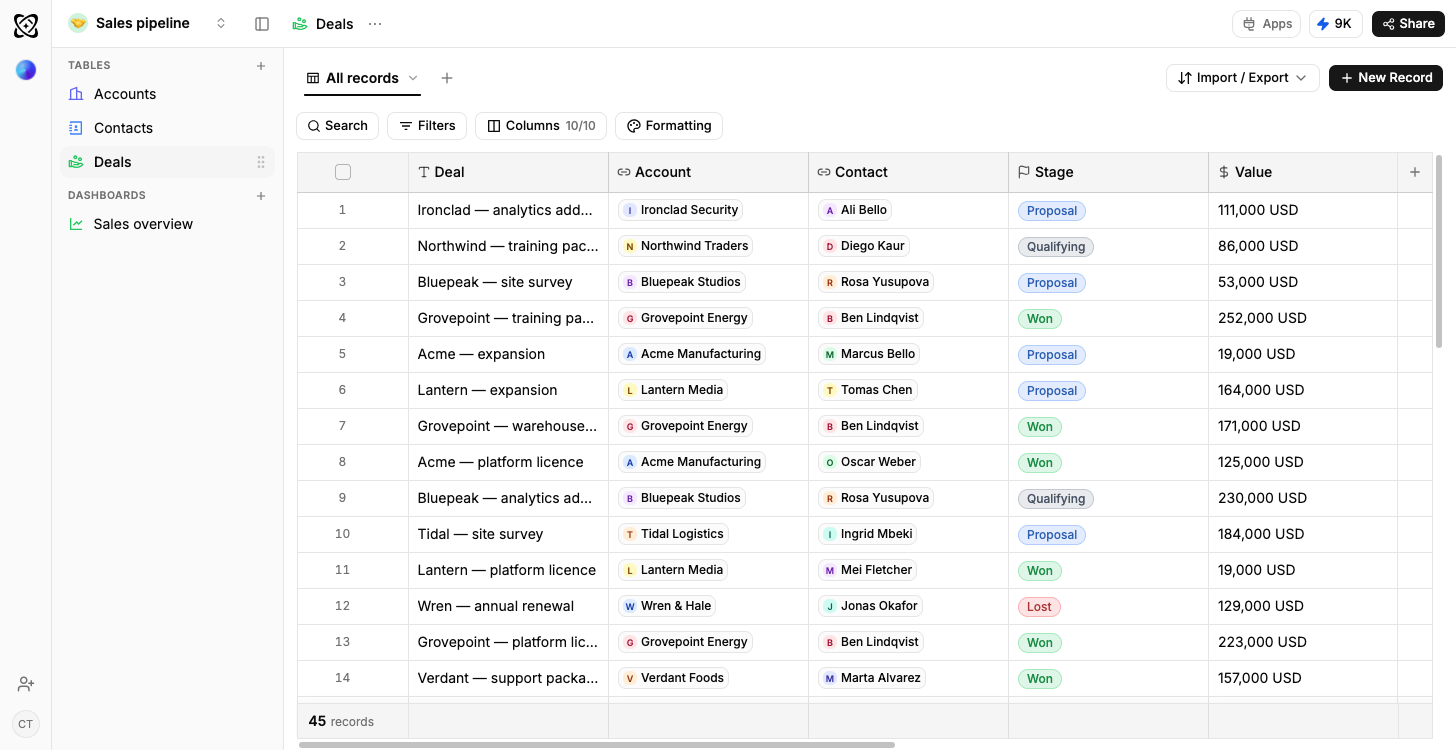
Sales pipeline
Open pipeline by stage, results by owner
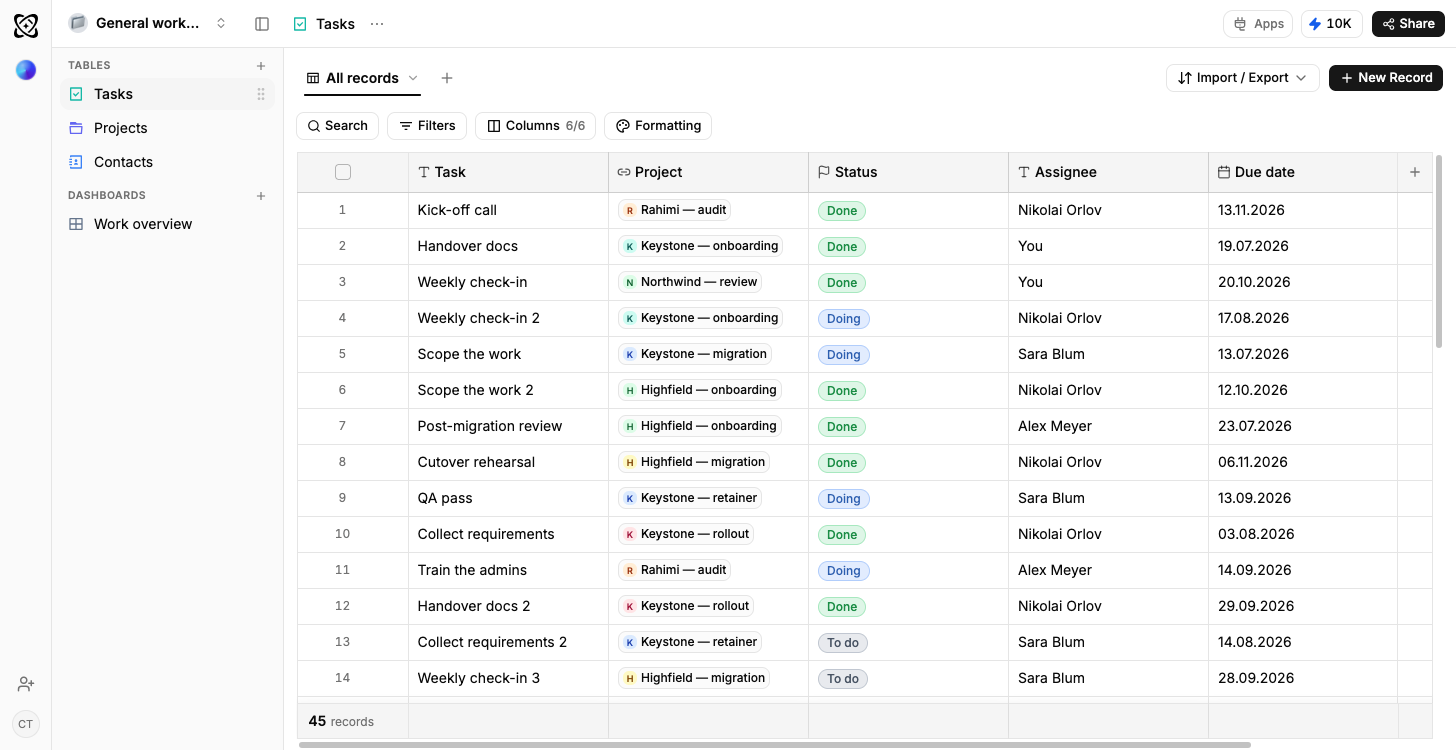
General workspace
Projects and budget by status
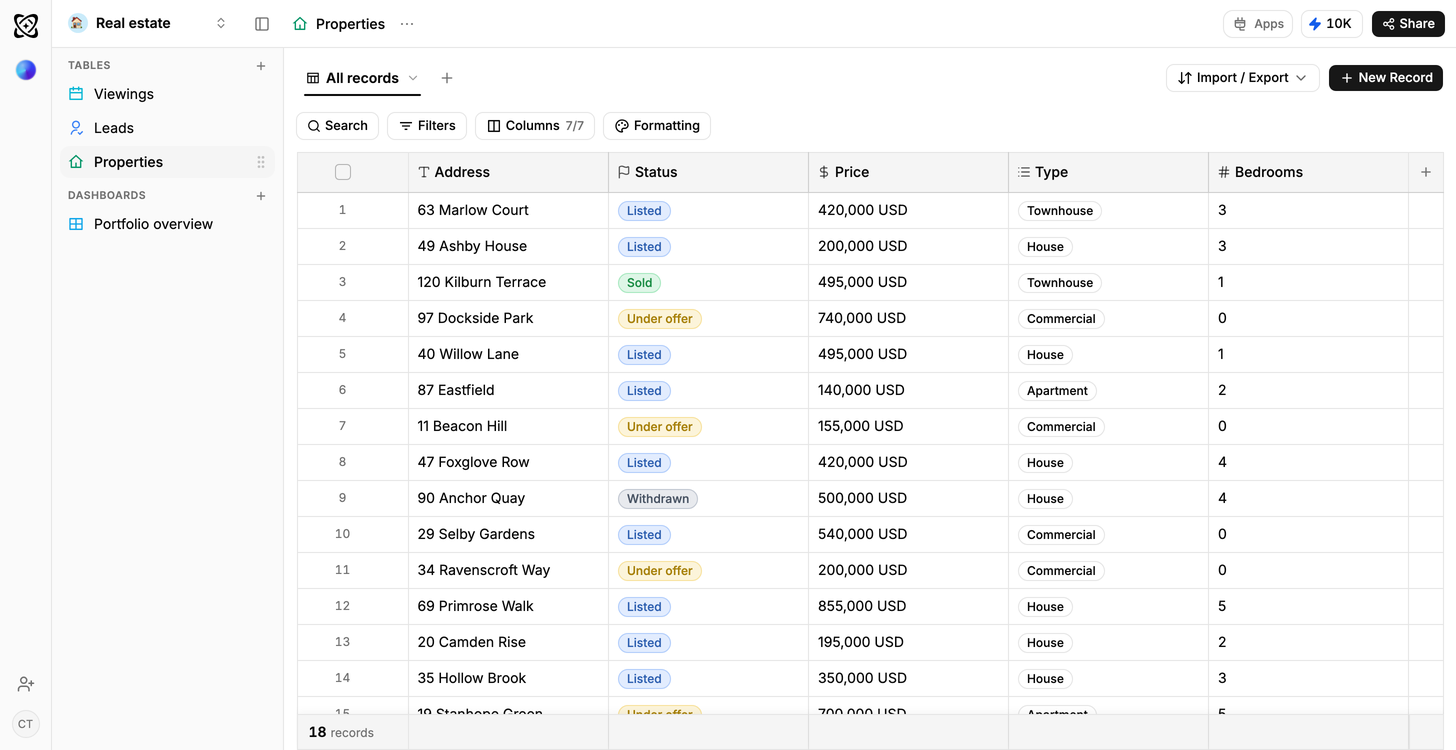
Real estate
Portfolio value and leads, by stage
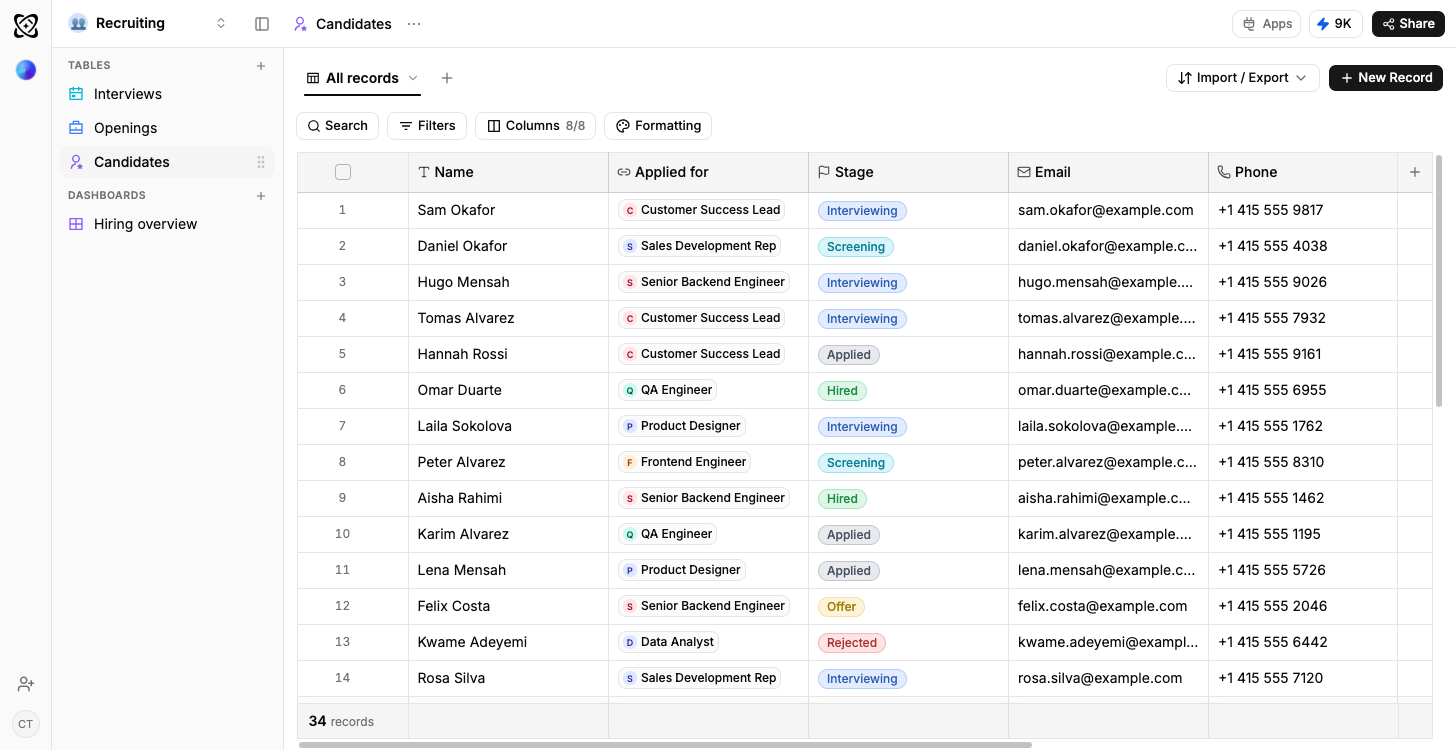
Recruiting
Candidates by stage, openings by status
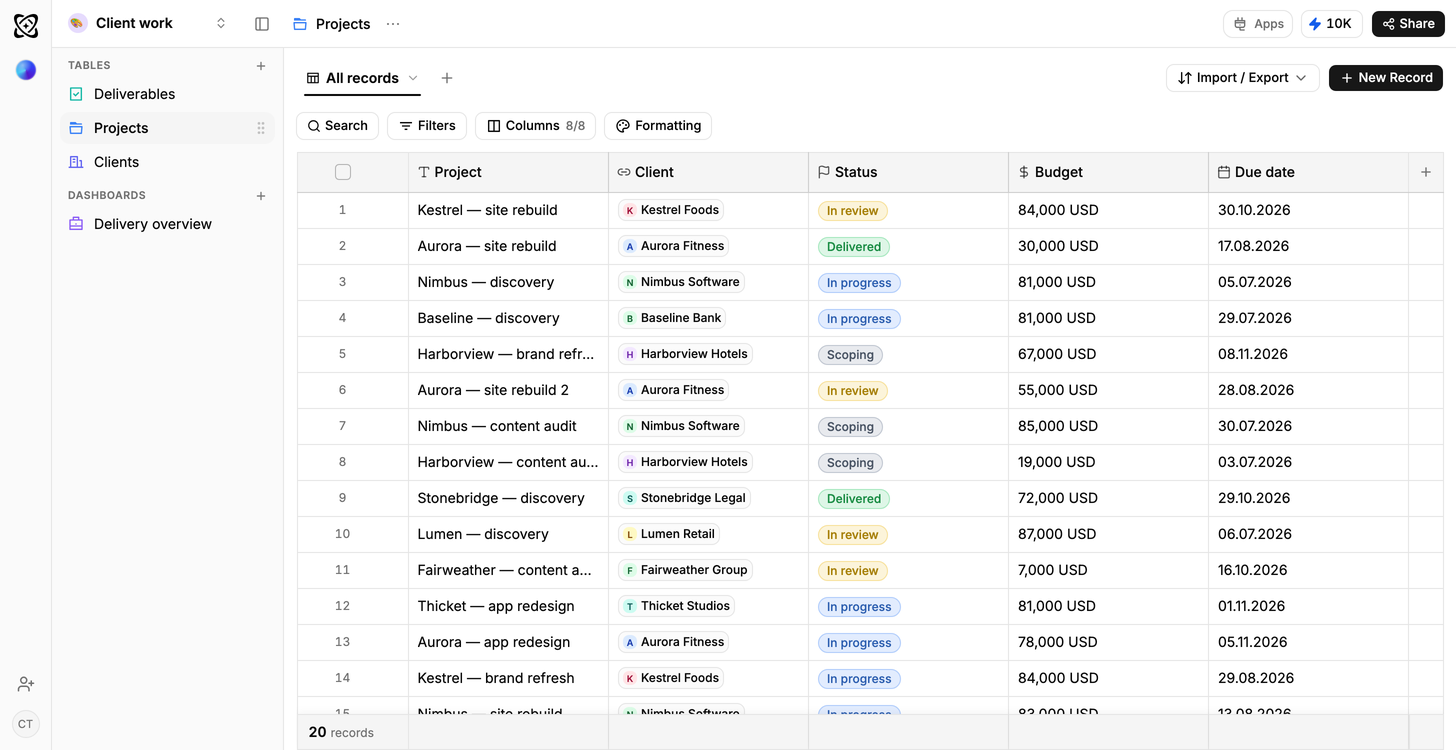
Client work
Due this week; shipped but not billed
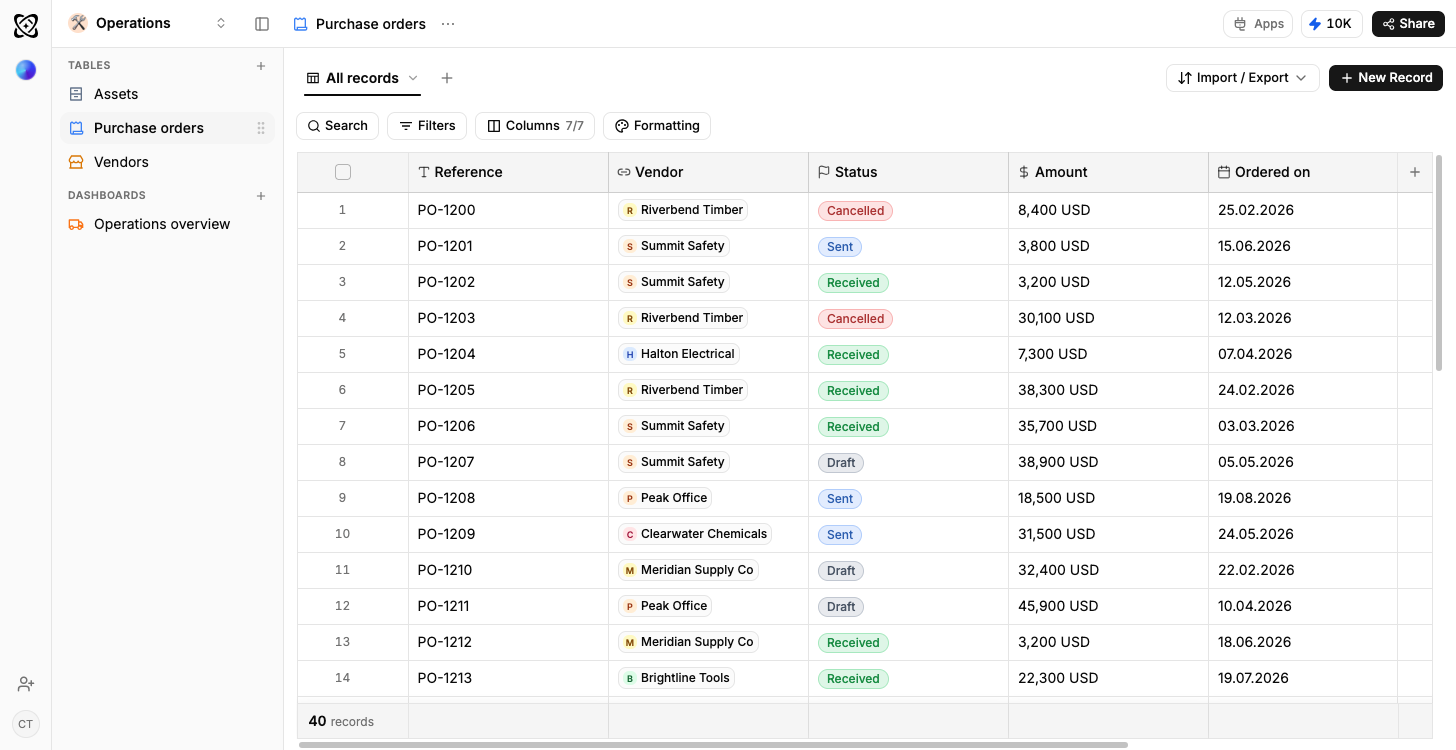
Operations
Orders in flight, spend by supplier
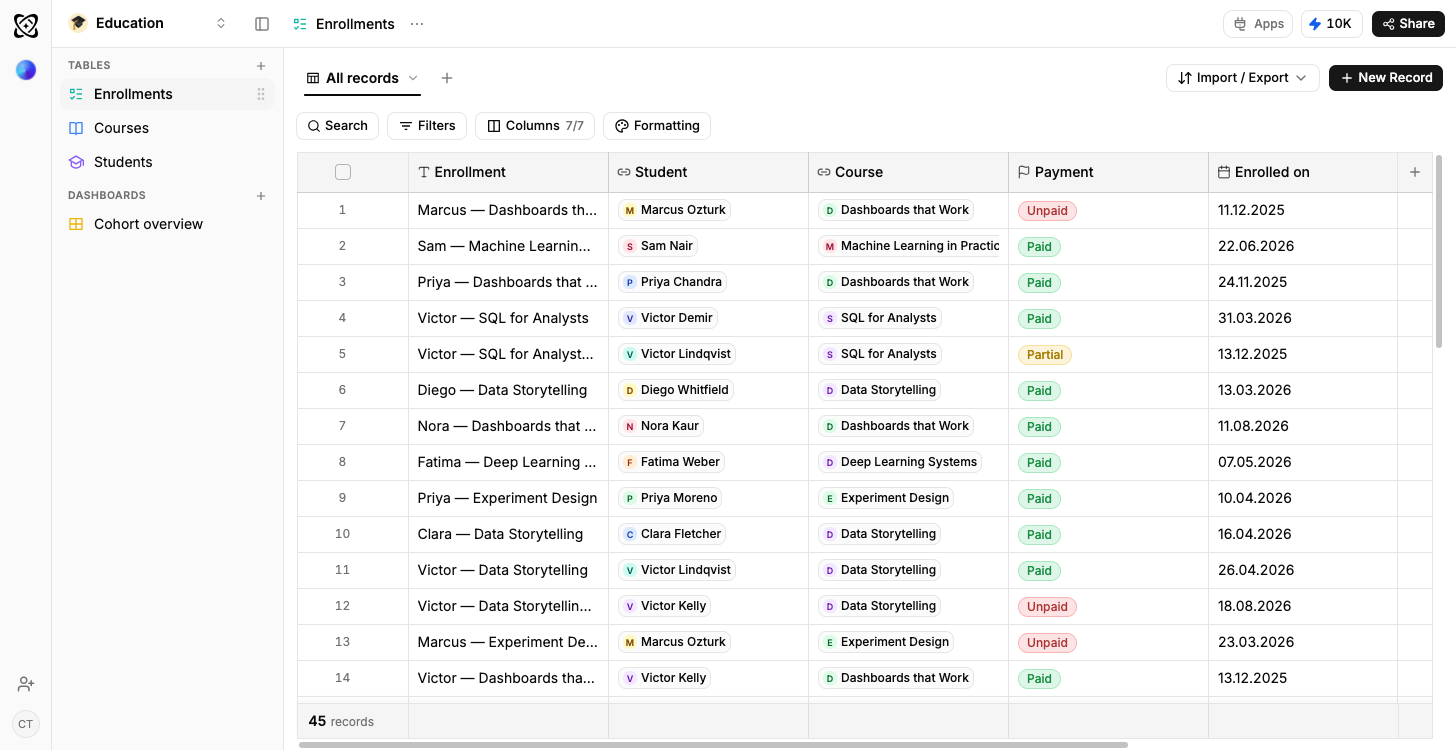
Education
Attendance and completion by cohort
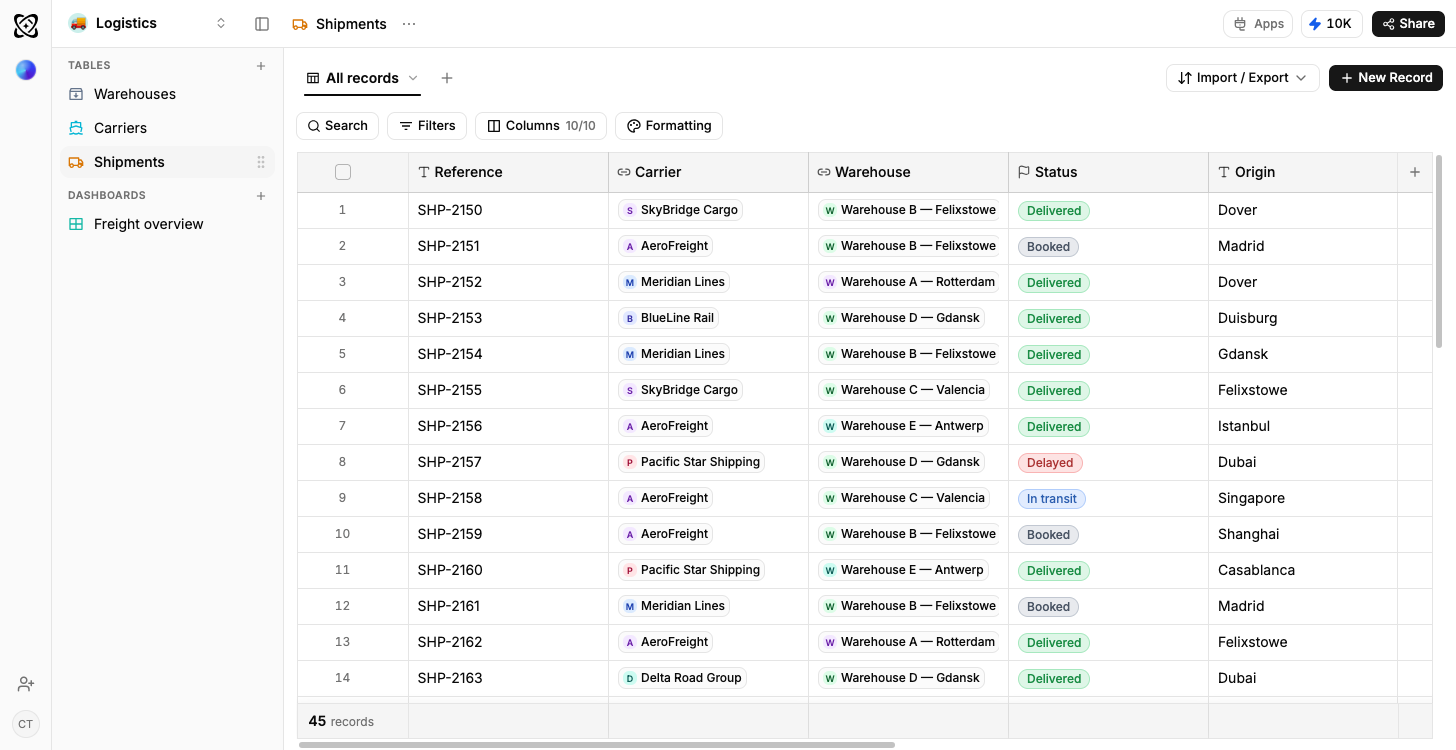
Logistics
On-time rate by carrier and lane