
How do you calculate statistical significance for an A/B test?
z = (rateB − rateA) / √( p̄(1−p̄) × (1/visitorsA + 1/visitorsB) ), where p̄ is the pooled conversion rate; confidence = two-tailed normal probability for |z|
One variant converts at 5%, the other at 6%: real win or coin flip? To answer that, divide each variant's conversions by its visitors to get the two rates, pool both samples into one average rate, and use that pooled rate to compute the standard error of the difference. The observed difference divided by that standard error is a z-score, and a two-tailed normal distribution converts the z-score into a confidence level: how unlikely a gap this large would be if the two variants actually performed the same.
95% confidence is the common bar, a z-score of about 1.96, and below it you treat the result as inconclusive, not as a small win. Two things corrupt the read. Small samples produce unstable rates, so a test with a few hundred visitors per variant will rarely clear 95% even when the difference is real. And checking results repeatedly, then stopping the moment significance appears, inflates false positives. Decide the sample size up front and read the number once.
When experiment results live in a Ferra table, visitors and conversions per variant, appended as each test ends, you can ask in plain English which tests cleared 95% and keep a running log of what actually shipped.
How the A/B test significance calculator works
Four counts go in: visitors and conversions for A, visitors and conversions for B. Out come each variant's conversion rate, the relative uplift of B over A, the z-score for the difference, and the confidence level that the gap is real rather than random noise.
- Visitors (variant A)
- Unique people who saw the control during the test, pulled from your testing tool or analytics. Count each person once: pageviews and sessions inflate the denominator.
- Conversions (variant A)
- How many of A's visitors completed the goal: a purchase or a signup, even a bare click. Count converters, not events: one person buying twice is still one conversion.
- Visitors (variant B)
- Unique people who saw the challenger, measured over the same period and with the same counting method as variant A.
- Conversions (variant B)
- Goal completions among B's visitors, on the same goal definition and the same time window as variant A.
Calculating A/B test significance
Variant A: 10,000 visitors, 500 conversions. Variant B: 10,000 visitors, 600. Rate A is 500 / 10,000 = 5.0% and rate B is 600 / 10,000 = 6.0%, a relative uplift of (6.0 − 5.0) / 5.0 = 20%. The pooled rate treats both samples as one: (500 + 600) / (10,000 + 10,000) = 1,100 / 20,000 = 5.5%.
The standard error of the difference is √(0.055 × 0.945 × (1/10,000 + 1/10,000)) = √0.000010395 ≈ 0.00322. Divide the observed gap by that error for the z-score: 0.01 / 0.00322 ≈ 3.10. A two-tailed normal lookup for z = 3.10 gives roughly 99.8% confidence, a gap this large would almost never appear by chance between two identical variants.
Mismatched denominators wreck more tests than bad math does. Count unique visitors for one variant but sessions or pageviews for the other, or pull the two variants' numbers from different date ranges, and one rate gets artificially inflated or deflated. The z-score then faithfully reports a difference your instrumentation created, not your design change.
What is a good confidence level?
95% is where most teams declare a winner. Some accept 90% for low-risk changes like copy tweaks; some hold out for 99% when the change is expensive to reverse: pricing, say, or checkout flow. In z-score terms, about 1.96 corresponds to 95% and about 2.58 to 99%.
High confidence means "the difference is probably real," not "the uplift is exactly this size": the true effect could be smaller or larger than the measured one. And a low confidence level, say 70%, doesn't mean the variants are equal. It means you can't yet tell the difference from noise, which usually calls for more traffic rather than a coin-flip decision.
How to improve A/B test significance
Significance rises with bigger effects and bigger samples; cleaner measurement helps just as much. Every lever below pulls one of those three.
- Run the test longer
- More visitors shrink the standard error, so the same uplift earns a higher z-score. Cover at least one full business cycle, usually a week or two, so weekday and weekend behavior both show up.
- Test bolder changes
- A 20% relative uplift reaches significance far faster than a 2% one. A substantively different page beats a new shade of button color.
- Fix the sample size in advance
- Decide how many visitors you need before starting, and stop only then. Checking daily and quitting the moment confidence crosses 95% inflates your false-positive rate.
- Aim at high-intent traffic
- A higher baseline conversion rate packs more signal into each visitor. The pricing page often reaches significance with a fraction of the traffic the homepage needs.
- Measure one primary goal
- Pick a single conversion event before launch. Testing five metrics and reporting whichever hits 95% first is how noise gets shipped.
- Split traffic evenly
- A 50/50 split gives the smallest standard error for a given total sample; a 90/10 split needs far more total visitors to reach the same confidence.
Other calculators
Browse all calculatorsRelated templates
Browse all templates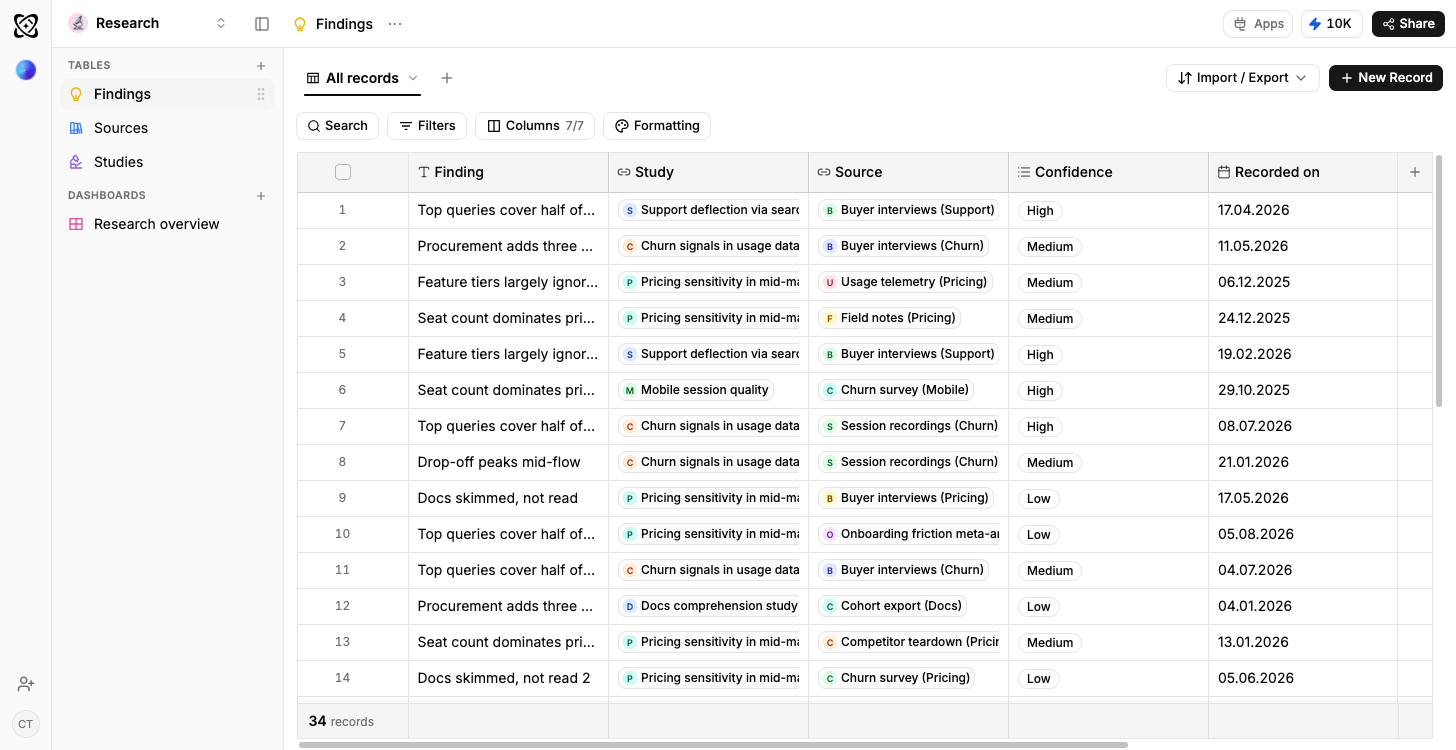
Research
Findings per theme, by confidence and source
- TikTok
- YouTube
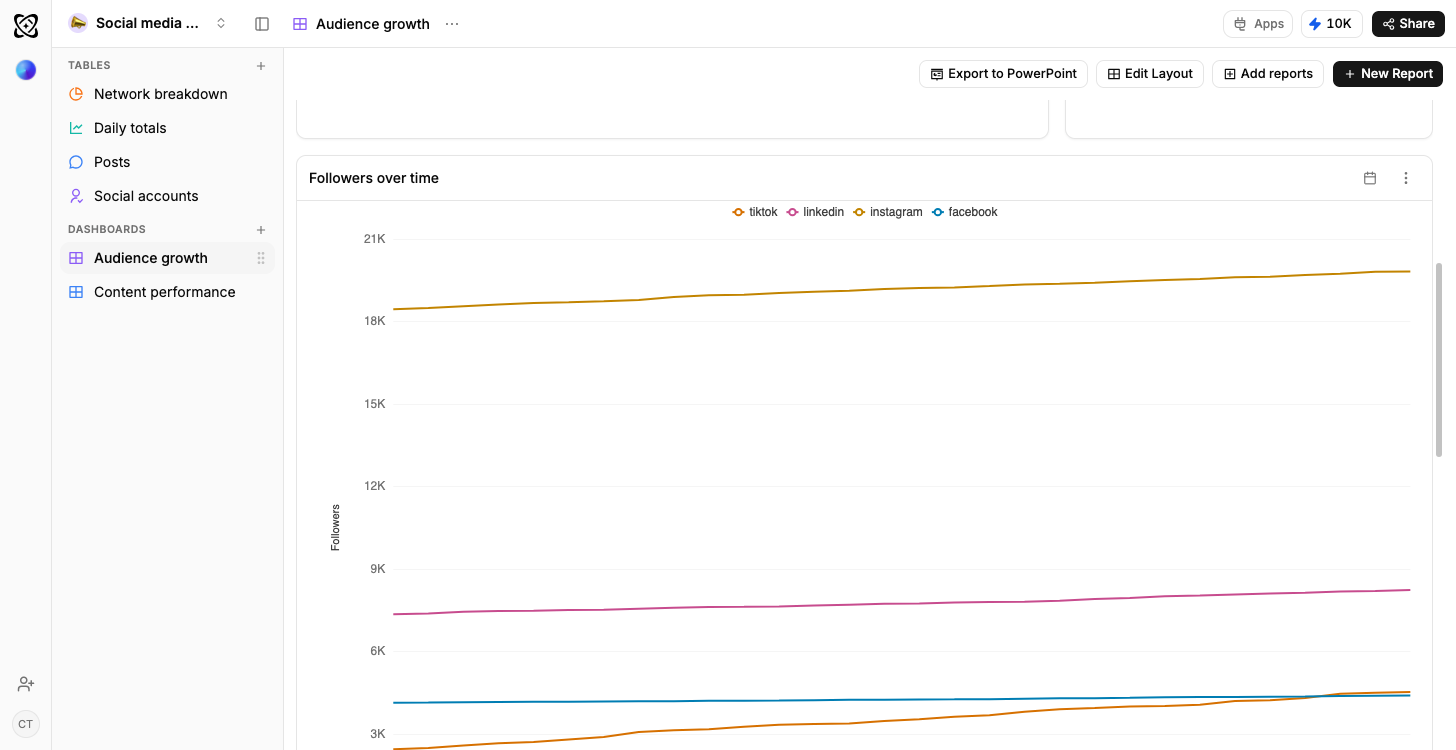
Social media analytics
Every channel compared, and what works where
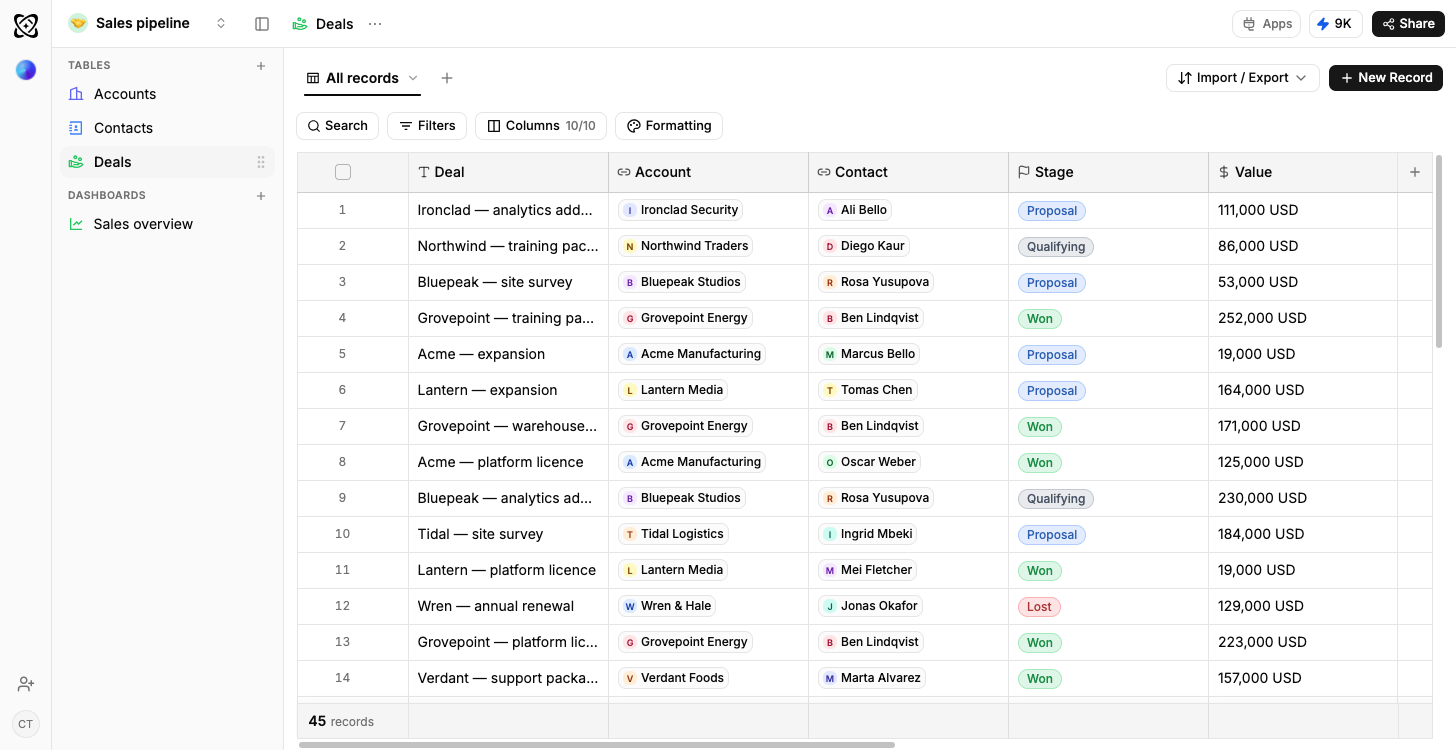
Sales pipeline
Open pipeline by stage, results by owner
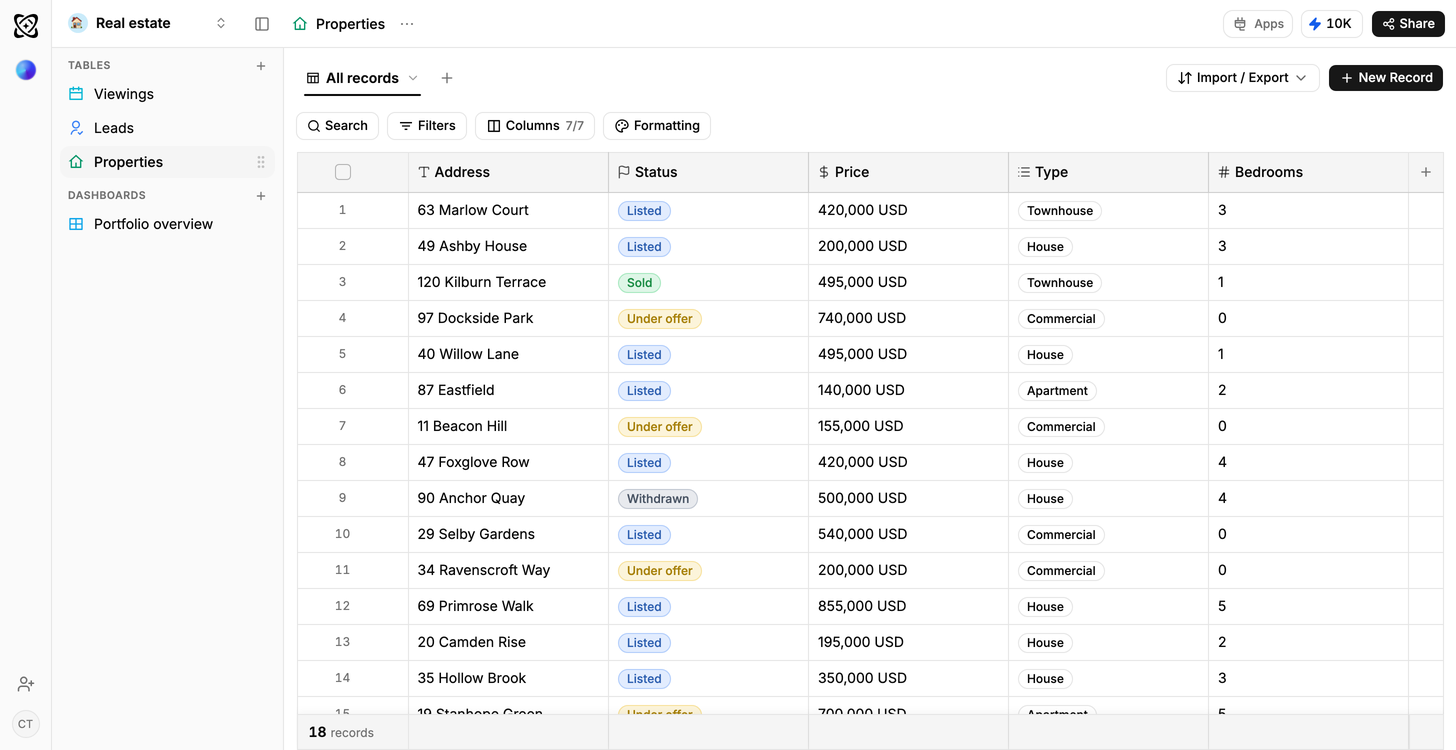
Real estate
Portfolio value and leads, by stage
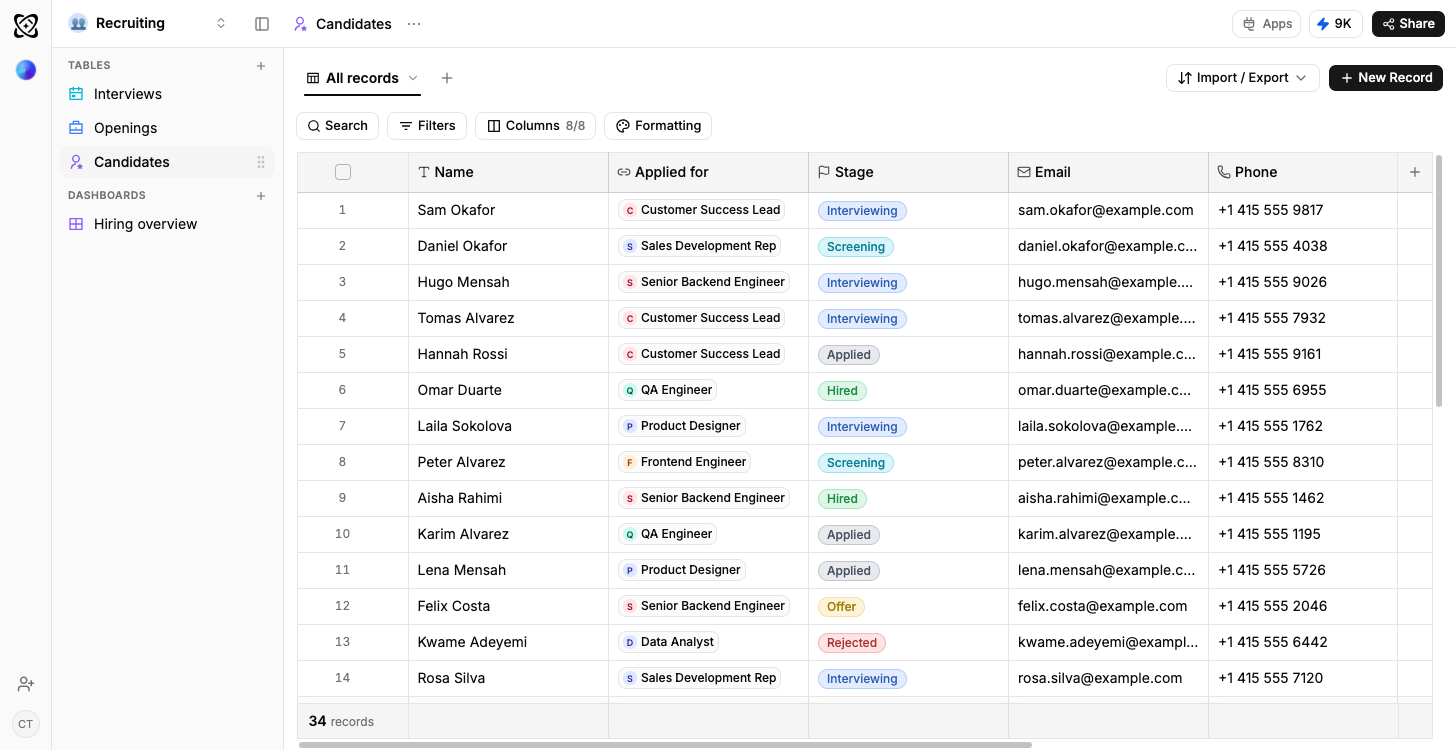
Recruiting
Candidates by stage, openings by status
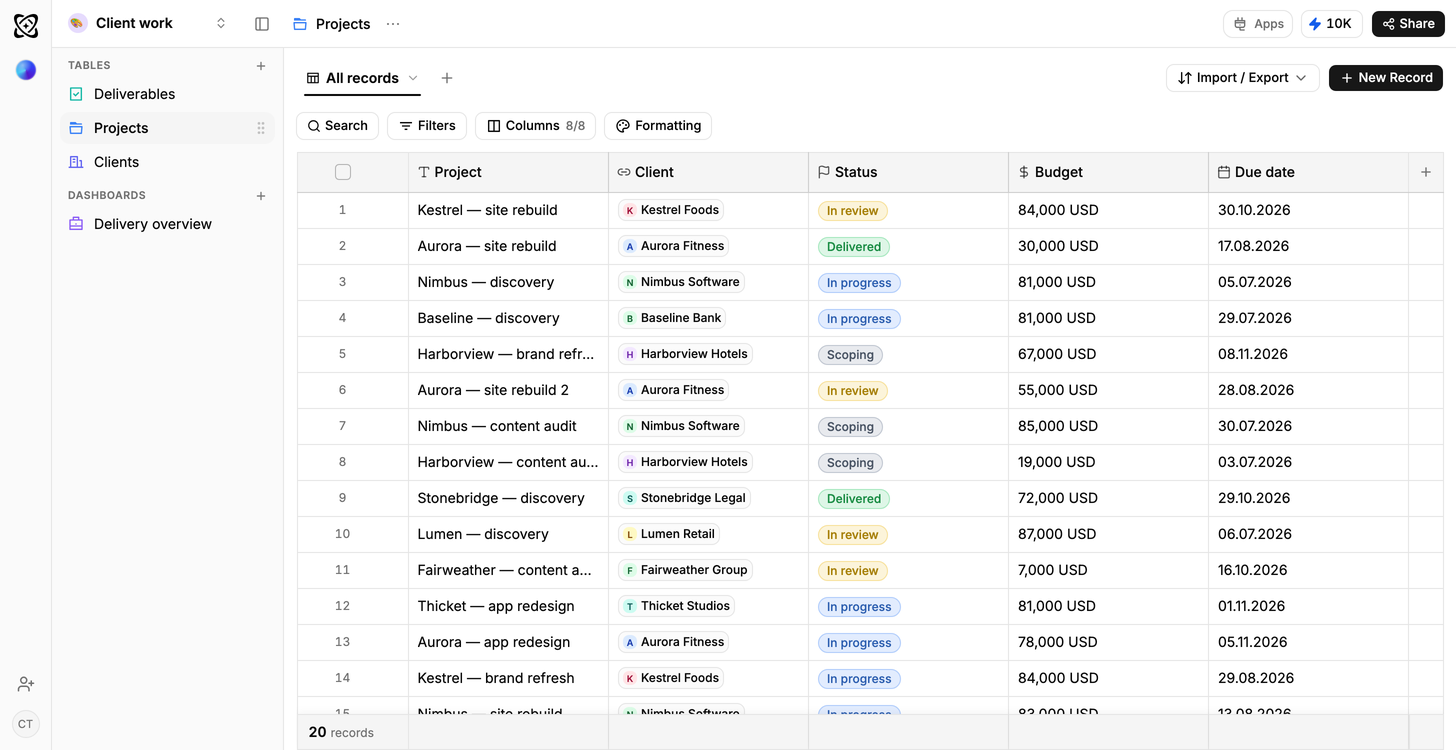
Client work
Due this week; shipped but not billed
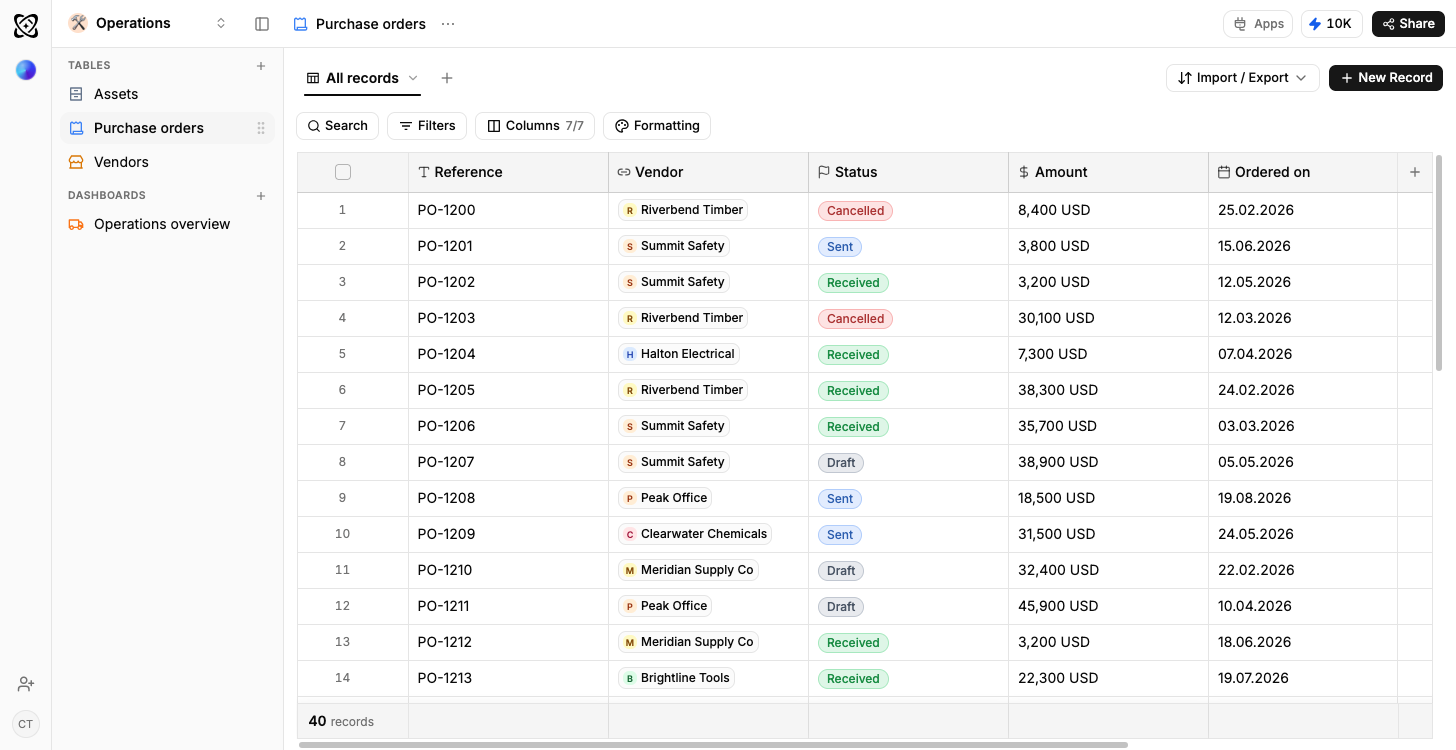
Operations
Orders in flight, spend by supplier
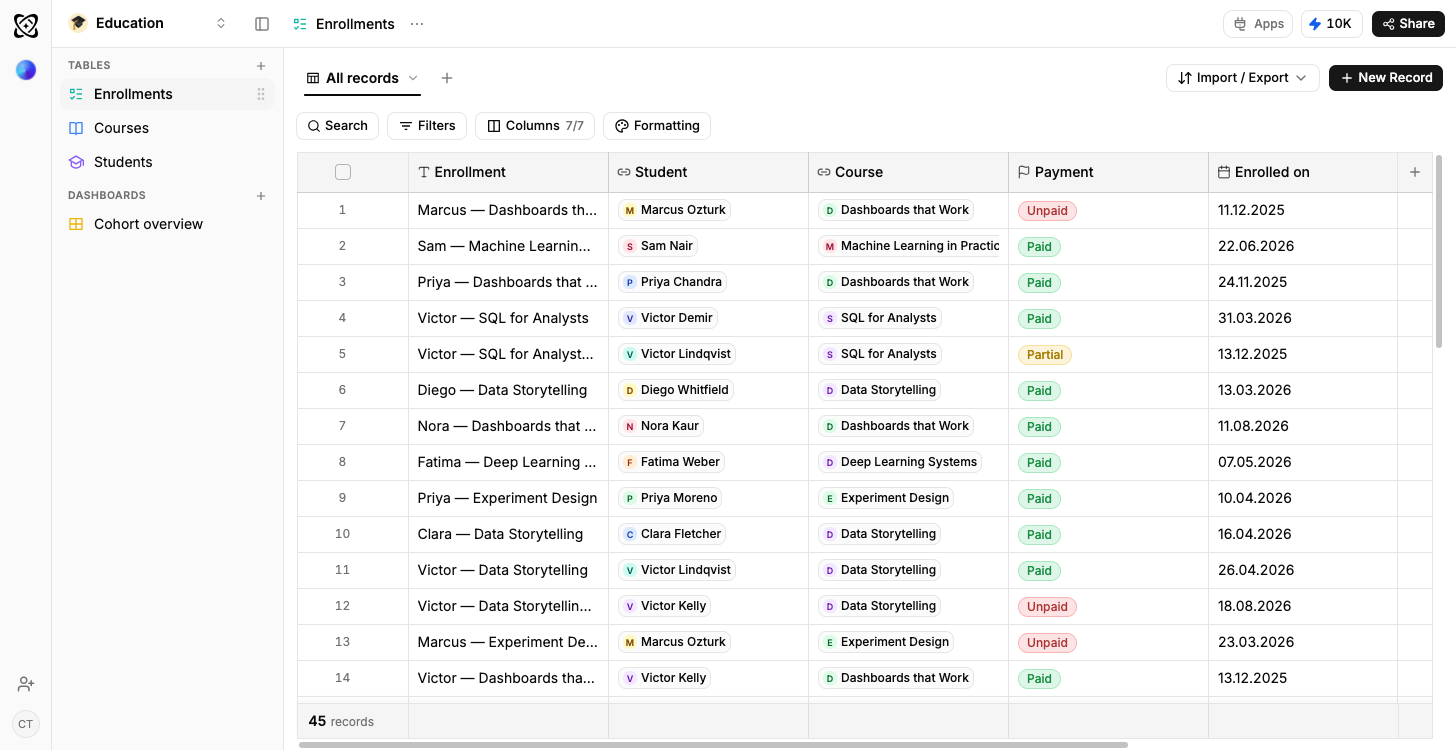
Education
Attendance and completion by cohort